Without over-analyzing the squiggles, here’s a summary assessment of the wave structure for a number of markets priced in USD. Hope it would be helpful as the year end approaches. Happy holidays!
Stocks
For a big picture discussion, please see Hope Rally Update (12/3/10). Chart 1 offers an update and Chart 2 gives a squiggle count of the current advance.
The primary count (red) places the near term high as [i] of C. Under this interpretation, the likely target for the entire hope rally is around 1352.
The top alternative counts are blue (long term bullish) and grey (long term bearish) which are identical for the near term. Under this interpretation, the likely targets before a sizable reversal are around 1246 where 5=0.618x1 and 1291 where 5=1.


Bonds (UST 10Y)
The 10-year Treasury yield has risen about 100bp (1%) since its October low, supporting the long term outlook that a multi-decade bull-market in bonds had ended in late 2008. For a big picture discussion, please see The Bond Mania (8/20/10).
From the October low, it’s possible to count a five wave rise in the 10Y index (TNX) (Chart 3) as well as the March contract (ZN) (Chart 4).
The primary count on the TNX is that wave 1 of (1) of [3]-up (a protracted sell-off in bonds) is approaching its end. Under this interpretation, the minimum target for the coming rebound is at yield levels corresponding to around 123-14/32 in the March contract. Once the rebound completes, the bear market in bonds will resume.
The top alternative count on the TNX is that the near term high in yield is wave [iii] of 3 of (1) of [3]-up. The implication is a much shallower retracement before another sell-off to complete 3 of (1).


Commodity Index (CRB), Gold and Oil
 Broad commodity indexes are approaching major tops but have upside potential in the near term. The CRB index is tracing out a corrective zigzag since its 2009 low with a target around 340 or 370 (Chart 5).
Gold (in USD) is completing the fifth wave of a larger fifth wave (Chart 6). The primary count (blue) sees gold having a shot toward the upper trend channel. $1400-$1500 is in sight under this interpretation. A break of the October and November lows will greatly diminish this potential. The top alternative count (red) suggests that gold has either topped or very nearly so.
Light Crude Oil (in USD) is likely tracing out a corrective zigzag since its late 2008 low (Chart 7). The primary count (blue) suggests upside a target around 114 or 132. The top alternative count (red) limits the upside potential to around 100.


USD
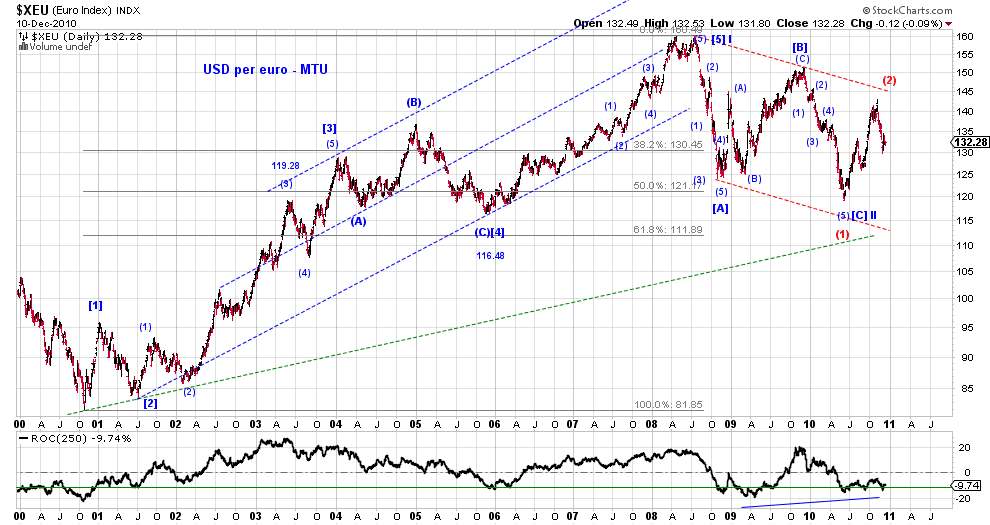
There are still too many valid options on the USD index despite the recent strength in the dollar (Chart 8). As a result, it is difficult to pick out a primary count. If pressed, one could make a case for the blue count. It suggests a lower low in the dollar before considerable strength returns. This scenario could correspond to a second wave retrace in bonds and the euro, as well as a wave [iii] of C advance in stocks per its primary count. The longer term wild card is the euro, which represents the largest share of the USD index. For a big picture discussion, please see Bottoming Euro (6/4/10). Chart 9 offers an update.