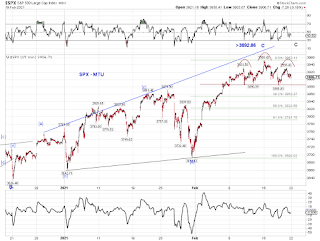
From a time perspective, the green (b) wave correction looks better for this potential expanding diagonal triangle. See Chart 1 & 2.
Since the price requirement has been met, the potential EDT could have ended at the recent high.
Watch the potential HS and monitor for follow-through or failure.


MTU, I dont know why you keep focusing on SPX because its the most unreadable index I have ever seen. If I were in US I wouldnt even consider trading it for that reason. Its always been a problem because of the 500 components in it even back in the 1980s.
ReplyDeleteChart 1 - note that from mid to end Jan there were 5 waves down and 3 waves up to the green (a) around 10 Feb - then it has stalled. And remember what I said 2 mths ago watching end of Feb.
Ray Dalio strikes again - sees the light this time.
ReplyDeletehttps://www.marketwatch.com/story/are-we-in-a-bubble-how-founder-of-worlds-largest-hedge-fund-says-2021-stock-market-stacks-up-11614010302?siteid=bigcharts&dist=bigcharts