* Time, Price and Gaps (12/27/19)
* Update (12/20/19)
* Triangle Apex (12/13/19)
* May/Aug Line (12/6/19)
* Profile (12/1/19)
* Update (11/22/19)
* Maturing (11/15/19)
* Profile (11/8/19)
* New ATH (11/1/19)
* NDX (10/25/19)
* WXY vs Triangle (10/18/19)
* Potential Terminal Triangle (10/11/19)
* Triangles (10/4/19)
* Red Line (9/27/19)
* Red Line (III) (9/20/19)
* Red Line (II) (9/13/19)
* Red Line (9/6/19)
* Megaphone Update (8/30/19)
* Lines and Megaphone Update (8/23/19)
* Lines (8/16/19)
* Bounce (8/9/19)
* Megaphone (8/3/19)
* Overthrow Territory (7/26/19)
* Wedges and Kisses (7/19/19)
* Wedging (7/12/19)
* Wave B tracking (7/5/19)
* Structures(6/28/19)
* Fibo(6/21/19)
* Structure(6/14/19)
* Kiss(6/7/19)
* Necklines(5/31/19)
* Necklines(5/24/19)
* Potential Head-and-Shoulders(5/17/19)
* MA(5/10/19)
* ABC to New HIgh(5/3/19)
* New High(4/26/19)
* Candles(4/18/19)
* ABC(4/12/19)
* ABC(4/5/19)
* Retrace, Momentum and Resistance(3/29/19)
* Retrace, Momentum, False Breakout? (3/22/19)
* Momentum (3/15/19)
* Retrace (3/8/19)
* Resistance (3/1/19)
* Resistance III(2/21/19)
* Resistance II(2/15/19)
* Resistance (2/8/19)
* Rebound (2/1/19)
* Rebounding IV (1/25/19)
* Rebounding III (1/18/19)
* Rebounding (1/4/19)
* 2019 Outlook (12/31/18)
Disclaimer: Each post is for informational purposes only. It is not a solicitation, a recommendation or advice to buy or sell any security or investment product. Information provided in each post does not constitute investment advice.
Tuesday, December 31, 2019
Sunday, December 29, 2019
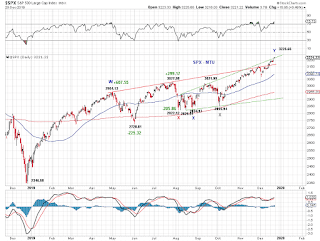
MTU Month-End Ed. - Time, Price and Gaps (12/27/19 close)
In Chart 1, wave B-up is about equal in time to wave A-down (from H1) and about 4 times in time as wave A-down (from H2). Wave B-up is at a respectable magnitude with respect to wave A down.
In Chart 2, wave Y-up (from the blue X) is about equal in time to wave W-up. Wave Y-up is at a respectable magnitude with respect to wave W-up.
The latest advance from the October low now has 7 unfilled gaps (Chart 3).
In Chart 2, wave Y-up (from the blue X) is about equal in time to wave W-up. Wave Y-up is at a respectable magnitude with respect to wave W-up.
The latest advance from the October low now has 7 unfilled gaps (Chart 3).
Saturday, December 21, 2019
Saturday, December 14, 2019
MTU Weekend Ed. - Triangle Apex (12/13/19 close)
Time wise, SPX is at the apex of a potential triangle (grey lines), although it's debatable whether it is a triangle.
Saturday, December 7, 2019
Sunday, December 1, 2019
Saturday, November 23, 2019
Saturday, November 16, 2019
Saturday, November 9, 2019
Saturday, November 2, 2019
Saturday, October 26, 2019
Saturday, October 19, 2019
MTU Weekend Ed. - WXY vs Triangle (10/18/19 close)
NDX invalidated the potential triangle we have been monitoring (red lines), SPX and INDU have not. NDX can very well diverge from SPX to trace out a larger triangle (blue line) or some other structure. However, the potential [w]-[x]-[y] structure (red) we have also been monitoring if NDX remains in sync with SPX.
SPX and INDU
SPX and INDU
Saturday, October 12, 2019
MTU Weekend Ed. - Potential Terminal Triangle (10/11/19 close)
This past Friday's event-driven rally in stocks is consistent with the personality of the E-wave of a triangle. If so, major indexes would be approaching the completion of a potential bearish triangle. Prices need to drop below the October low to confirm such a scenario. See charts (red count).
Saturday, October 5, 2019
MTU Weekend Ed - Triangles (10/4/19 close)
Once again, watch the (upward sloping) red line. In addition, monitor the potential smaller EDT (blue) and the potential larger EDT (green).
Completion count
Completion count
Saturday, September 28, 2019
MTU Month End Ed - Red Line (9/27/19 close)
The red line has so far served as viable resistance against the upswing from the August low in SPX. Note that the red line is upward sloping, the extent of advance over the past two months raises the question whether the potential megaphone is complete. With this past week's drop, SPX is currently sitting on its SMA50 and also tests its late 2018 high and May 2019 high.
Completion count
Big picture tracking
Completion count
Big picture tracking
Saturday, September 21, 2019
MTU Weekend Ed. - Red Line (III) (9/20/19 close)
It's the red line till it's not. SPX reacted to the red line this past week once more and closed below it. However, the red line is sloping upward.
Saturday, September 14, 2019
MTU Weekend Ed. - Red Line (II) (9/13/19 close)
SPX is hugging and reacting to the red line, which is sloping upward. The Dow is closer to a new ATH than SPX.
Saturday, September 7, 2019
Sunday, September 1, 2019
MTU Month End Ed - Megaphone Update (8/30/19 close)
If the megaphone is in place, SPX is likely making a w-x-y upward retrace to test the red line. Otherwise, a larger DT to test upper green line is an option.
Megaphone update
Megaphone update
Saturday, August 24, 2019
MTU Weekend Ed. - Lines and Megaphone Update (8/23/19 close)
Lines update - SPX was rejected by the 2018 high and the red line, probing the green line below and yet to confirm a meaningful break.
Megaphone update - As discussed before, if the megaphone pattern plays out, "the traditional measured target for the megaphone is 2150-2350 in SPX."
Megaphone update - As discussed before, if the megaphone pattern plays out, "the traditional measured target for the megaphone is 2150-2350 in SPX."
Sunday, August 18, 2019
MTU Weekend Ed. - Lines (8/16/19 close)
Watch the green line below and the red line above.
completion count
P.S. Thanks for Mkt Man for informative comments.
completion count
P.S. Thanks for Mkt Man for informative comments.
Subscribe to:
Posts (Atom)


