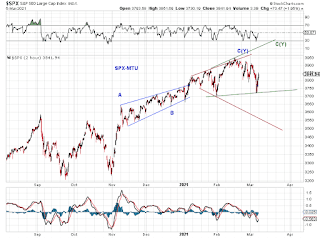
Chart 1 - SPX saw a three-wave down so far from its ATH (blue C) or high at a potential failure (green C). It does not rule out a reversal, in view of the Higher Degree Tracking (2/26/21). For example,
The ATH could have marked the end of a megaphone (Chart 2, red)
Waves down from the blue C can morph into a larger flat-down.
Waves down from the green C can morph into an expanding LD-down.
Chart 2 - However, support has held and SPX rebounded vigorously Friday. SPX could be in the final zigzag up of an expanding diagonal (green C(Y))
Chart 3 - A double-three looks better than a triple-three based on time. Note that the first three lasted 5 months, the current three lasted 4 months, (going for 5 months at the second C(Y).)


Replying to your reply from THURS about the neg 5 down in Chart 1 (which I cannot reply there due to some website tech problem):-
ReplyDeleteSurely you realize corrective / negative waves can trade sideways ?
Its a reverse expanding triangle containing 5 waves which has to be interpreted as a neg seq trading sideways. It is distorted tho.
Seen these before many times.
Surprised you dont understand.
Dont get fooled by whether a wave is higher or lower than it should be in these distorted seqs.
That peak on 8 Jan is also a completed seq from earlier on going back to Dec.
That entire down move from 20 Jan to 31 Jan is certainly not an abc - its a 5 down. Then its followed by what looks like an abc up (confirmed by count seqs after that point). And if its a 5 down within a triangle it has to be part of a 5 wave seq. NOTE also the 5 down (8-31 Jan) took 22 days approx and the abc rally stalled 11 days (50% time) on 11 Feb.
The peak on 11 Feb is the true EW count peak of that top in my view, not the latter peak which is neg wave 2 of the next 5 down to 23 Feb.
Thanks. What you call neg five down is and expanded flat down (or expanded correction w-x-y down), as potentially the case from Feb 11 high to Feb 23 low, which is the basis for the green C count.
ReplyDeleteYour 11 - 23 Feb seq to green C is not the symetrical triangle seen in Jan, its as really a downward sloping flag with a bit of a pennant shape to it. That flag starts on 10 Feb amigo.
Delete