Monday, December 31, 2012

Market Timing Update (12/31/12)

[EOD] Stocks -
See recent updates for discussions.


[255pm] SPX squiggles and VIX fractal -
Chart 1 shows the tracking count on SPX squiggles from its recent low. Please see the 1230pm update for larger counts where these squiggle counts would fit. Chart 2 highlights a potential "fractal" in VIX for it to complete the proposed C-down.


[1230pm] SPX update -
Here's an update on the squiggle count on SPX since the cliff high. Please see discussions here.


[830am] ES update -
Last day of 2012. ES testing potential support around the prior neckline and Fib618 retrace. See chart.


Saturday, December 29, 2012

MTU Weekend Ed. - 2013 Outlook (12/28/12 close)

Happy New Year!


Stocks -
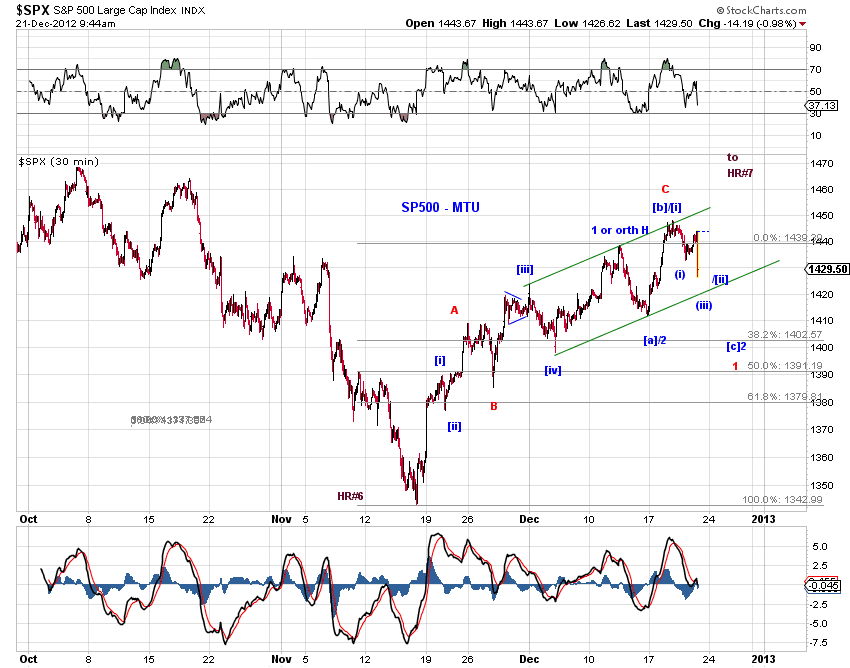
The final upswing of the Hope Rally is likely in progress (Chart 1). The fiscal-cliff related decline is likely a temporary pullback. The sell-off has now pushed SP500 to the proposed target area around 1395 based on our analysis of the potential fractal (Chart 2). See Cliff (12/21/12) for more discussions on the proposed fractal. See Market Timing Update (12/28/12) for near term tracking counts and squiggles.


Bonds -
U.S. 10Y Treasury note yield is wrapping up a potential zigzag decline which has lasted more than three decades (Chart 3).  The proposed wave [C] of the decline in yield is likely an ending diagonal triangle as indicated in Chart 3 and analyzed in Chart 4.

It is anyone's guess when and where the proposed EDT would end.  As long as 10Y yield finds its low above 46bp (0.46%), the proposed EDT survives.  In reality, the recent low around 1.39% is as good a low as others, and around 0.97% is a decent spot for an overthrow as well as support.


USD -
The USD index is likely to be range bound for some time, likely as part of a larger triangle (Chart 5).  A piece of supporting evidence is that the recent advance from the 2011 low counts better as a three-wave structure than a five-wave one (Chart 6).  Whether the proposed triangle is bearish (Chart 5, blue) or bullish (Chart 5, green) for the green back remains to be seen - the 2012 high and 2011 low are thus key pivots.


Gold -
Gold is likely in a wave [4] decline off its low around the turn of the century (Chart 7).  Once wave [4] concludes, wave [5] should push gold to a new high.

Since the proposed wave [2] sell-off was deep, the current wave [4] correction is likely sideways based on wave structure's tendency to alternate. Chart 8 presents our primary wave count on gold off its recent major low, the 2008 financial crisis low.


2012 Weekly Commentary

* 2013 Outlook (12/28/12)
* Cliff(12/21/12)
* Retrace(12/14/12)
* Nonconfirmation(12/7/12)
* Triple screen, Hope rally and Fractal extrapolation (11/30/12)  
* Upswing (11/23/12) 
* Follow Through (11/16/12)  
* Post Election Plunge (11/9/12)  
* Potential Upswing (11/2/12)  
* Target Zone(10/26/12)  
* Dip(10/19/12)  
* Correction approaching its end(10/12/12)  
* 3-up or C-down(10/5/12) 
* Rebound(9/28/12) 
* Countdown(9/21/12)  
* Are We There Yet?(9/14/12) 
* Break Out(9/7/12)  
* Hope Rally Update (8/31/12) 
* Reaction (8/24/12)  
* New 2012 High (8/17/12)  
* Tug of War(8/10/12)  
* Moment of Truth(8/3/12)  
* Breaking(7/27/12)  
* Short Term Update(7/20/12)  
* More Consolidation(7/13/12) 
* Consolidation(7/6/12)  
* Retesting or Rolling Over(6/22/12)  
* Breakout or Retest(6/15/12)  
* Bounce (6/8/12)  
* C/c-apitulation (stocks and bonds) (6/1/12)  
* Inside Week(5/25/12)  
* Technical Damage and Support(5/18/12)  
* DAX and SP500(5/11/12) 
* Consolidation or Topping Process(5/4/12)  
* Short Term Update(4/27/12) 
* Short Term Update(4/20/12)  
* Retest(4/13/12)  
* Outlook(3/29/12)  
* Shift (3/23/12)  
* Long term resistance (3/16/12)  
* Reset? (3/9/12)  
* Base Channel(3/2/12)  
* Rolling Over(2/24/12)  
* Turn Window(2/17/12) 
* NDX points the way (2/10/12)  
* Ready, Set, ***!(2/3/12)  
* Squeezed (1/27/12)  
* Shifting Odds (1/20/12)  
* Downgrades, QE3 and Top Tick (1/13/12)  
* Top Tick (1/6/12)  
* 2012 Outlook (12/30/11)


Friday, December 28, 2012

Market Timing Update (12/28/12)

[PS] Near term charts and squiggles -
Chart 1 presents the top tracking counts on SPX since the Nov low, where
(red) The December high is the end of a zigzag-like ABC structure. The fiscal-cliff related decline is either (1) the initial decline of a major downswing threatening the Nov low (1343) or
(2) an X wave to end above the Nov low (1343) prior to another advance beyond the Dec high (1448).

(blue) The lower mid-December high (1439) is the end of a five-wave advance (1 or A) as labeled. The December high (1448) is wave [b]-up of an [a][b][c] pullback for wave 2 or B.  The fiscal-cliff related decline is the proposed wave [c]-down.

Chart 2 zooms in on the wave structure of the decline from the "fiscal-cliff high", where
(red) SPX is wrapping up wave [iii]-down from the cliff high. [iv]-up and [v]-down are to follow before a meaningful bounce or a new upswing takes place.
(purple) A five wave decline ended on 12/27.  A potential meaningful bounce is likely taking the form of an expanded flat.  The market is wrapping up [b]-down of the proposed expanded flat.  The subsequent [c]-up is likely to drive SPX to above 1420 but below the cliff-high (1448) before reversing for lower lows. 
(blue) SPX is wrapping up a double zigzag corrective decline as labeled. A new upswing beyond the cliff-high (1448) is likely to follow.


[EOD] Stocks -
SPX and ES (after hours) are once again at their respective prior neckline. They are also around the 1395 target area discussed in Cliff (12/21/12). See charts.


[915am] ES update -
ES is retesting yesterday's low (Chart 1 and Chart 2) as expected. ES is approaching the flash crash trendline on the daily (Chart 1).


Thursday, December 27, 2012

Market Timing Update (12/27/12)

[EOD] Stocks -
SP500 bounced strongly off the prior neckline (Chart 1). This is a decent place to end the pullback (Chart 2 blue count). A retest of today's low remains likely.


[1035am] SPX update -
The key resistance held(see the 820am update). SPX is retesting the prior neckline (Chart 1 to the right). Chart 2 updates the tracking counts which remain the same and Chart 3 the squiggle count.


[820am] ES update -
The overnight advance is now facing potential key near term resistance. A meaningful rebound / even a bottom is likely if such resistance gives way. Otherwise, a retest of the "flash crash" lows is likely. See chart.


Wednesday, December 26, 2012

Market Timing Update (12/26/12)

[1250pm] SPX update -
The green count shows a five-down from the recent high ending with a post triangle thrust down this morning. The blue count allows for some form of extension. See chart.

[740am] ES update -
Potential small degree triangle in ES. See charts.


Friday, December 21, 2012

MTU Weekend Ed. - Cliff (12/21/12)


It is our view that the proposed final upswing of the Hope Rally is likely to resume in the foreseeable future. Note that the SP400 mid-cap index has now registered a fresh Hope Rally high (Chart 1).

However, U.S. stocks have now pulled back sharply on fiscal cliff related pessimism. How do we put near term price actions into perspective?

Chart 2 presents the potential fractal in SPX that we have analyzed several times in the recent past. If price patterns continue to rhyme, the current pullback is likely a downswing from point 8 to point 9 which can coincide with rising market anxiety as U.S. finally arrives at the edge of the fiscal-cliff.  The corresponding level for point 9 is about 1395. 


In terms of wave structure, the sell-off is likely wave [c] of the retrace discussed in Retrace (12/14/12).  The blue count in Chart 3 illustrates.  Note that wave [c]-down can and is likely to extend towards the 1395 target under this interpretation.  Also note the immediate bullish count (Chart 3, green) and the bearish count (Chart 3, red). 


Market Timing Update (12/21/12)

[945am] SPX and VIX updater -
From the perspective of the cash index. See charts.


[855am] ES updater -
Overnight sell-off on fiscal cliff pessimism. It reminds me of the initial TARP vote. Chart 1 offers the larger count and Chart 2 squiggles. It appears that the overnight low is likely to be retested.


Wednesday, December 19, 2012

Market Timing Update (12/19/12)

[EOD] Stocks -
SPX reacted to the longer term trend line resistance discussed yesterday (Chart 1). Chart 2 shows near term tracking counts.


[1145am] SPX squiggles -
See chart. See yesterday's EOD update for discussions on the larger count.