Thursday, April 30, 2015

Market Timing Update (4/30/15)

[EOD] Stocks -
SP500 did fill the gap and closed below several support levels. While SP500 did not breach the April 17 low, several indexes did. Hence, the bullish counts are adjusted accordingly, while the bearish count has a meaningful top in place. See charts.

[1015 am] SPX update -
SPX is back inside prior range and now probing the lower band hugging the green line (Chart 1). Is there downside momentum on this leg to fill the gap in Chart 2?

[745 am] ES update -
Month End. Minor overnight lower low. Wave A/C equality for the gray triangle B is at 2131, if the low holds. See chart.


Wednesday, April 29, 2015

Market Timing Update (4/29/15)

[120pm] SPX update - If the low holds, keep an eye on the stealth bullish triangle as well as potential subsequent failure of the final thrust (anything above [A] around 2110 satisfies). See the black blue count in Chart 1 and the larger blue count in Chart 2.

[1030am] SPX update -
Probing prior support again. Lines and squiggles. See charts.


Tuesday, April 28, 2015

Market Timing Update (4/28/15)

[105pm] SPX update -
SPX managed to move above key support lines, again (Chart 1). Lines and squiggles (Chart 1 and 2).

[745am] ES update -


Monday, April 27, 2015

Market Timing Update (4/27/15)

[EOD] Stocks -
SP500 is retesting the range, the red and green support lines (Chart 1). We could see the 2090 area if these support levels fail, and new highs if these support levels hold (Chart 2). SP500 ended the day short-term oversold (Chart 3).
[735am] ES update -
ES made new highs overnight. See chart. Is this(a) the upside gap attempt at the cash market OR (b) completion of the blue [iii] or an attempt to complete the blue [iii] or red (e) in this chart discussed in New High, But ... (4/24/15) ?


Sunday, April 26, 2015

MTU Weekend Ed. - New High, but ... (4/24/15 close)

The April 17th pullback to 2072.37 in SP500 did turn out to be a terminal decline in a corrective pullback (see Breakout Failure, minor or major? (4/17/15)), as SP500 and Nasdaq indexes joined SP400, Russell2000 and Wilshire5000 to make new 2015 highs (Chart 1).


While SP500 poked slightly above its multi-month range (Chart 2), upside momentum and market internals since the April 17th low have been unimpressive. See Chart 3 and Chart 4.

Thus we monitor the possibility the post April 17th upswing is
[1] a maturing initial wave, e.g., as wave [1] of the blue c in Chart 1. Expect a small pullback to correct the advance since 2072.37. OR
[2] a terminal wave, e.g., as the entire blue c in Chart 1. Expect a sizable decline to at least test the lower end of the multi-month range. On the bullish side, a convincing upward gap away from the multi-month range would serve as confirmation for a true break out.


Thursday, April 23, 2015

Market Timing Update (4/23/15)

[EOD] Stocks -
SP500 and Nasdaq indexes made fresh 2015 highs today. Today's all-time high in SP500 is likely part of the blue wave c or the red wave (e) in Chart 1. Note that SP500 broke out of a potential bullish triangle today and is making another attempt at breaking above a multi-month consolidation range highlighted in Chart 1. If the upside momentum picks up convincingly, the green wave (3)-up would gain credibility. A reversal back inside the range would register another breakout failure.

Chart 2 tracks the upswing off the April 17th low.


Wednesday, April 22, 2015

Market Timing Update (4/22/15)

[735am] ES update -
ES has probed the Fib618 retrace overnight. The immediate gap below and the lower line of a potential at a larger degree are other targets if further decline materializes. See chart.

Tuesday, April 21, 2015

Market Timing Update (4/21/15)

[EOD] Stocks -
Lines and squiggles. See charts.

[1120am] SPX update -
SPX struggles with the red line resistance (Chart 1), rebounds at initial support but is susceptible to a potential HS pattern (Chart 2).

Monday, April 20, 2015

Market Timing Update (4/20/15)

[EOD] Stocks -
SP500 filled Friday's gap as the likely trajectory suggested, and is now at resistance (Chart 1).
Chart 2 (blue and green) presents the bullish counts discussed in the weekend commentary. A retest of the lower line of the triangle cannot be ruled out.
A more bearish scenario is tracked by Chart 3, which is also discussed in the weekend commentary. It counts (potentially) today's high as point 11B.

[730am] ES update -


Saturday, April 18, 2015

MTU Weekend Ed. - Breakout Failure, minor or major? (4/17/15 close)


Stocks succumbed to resistance (See 
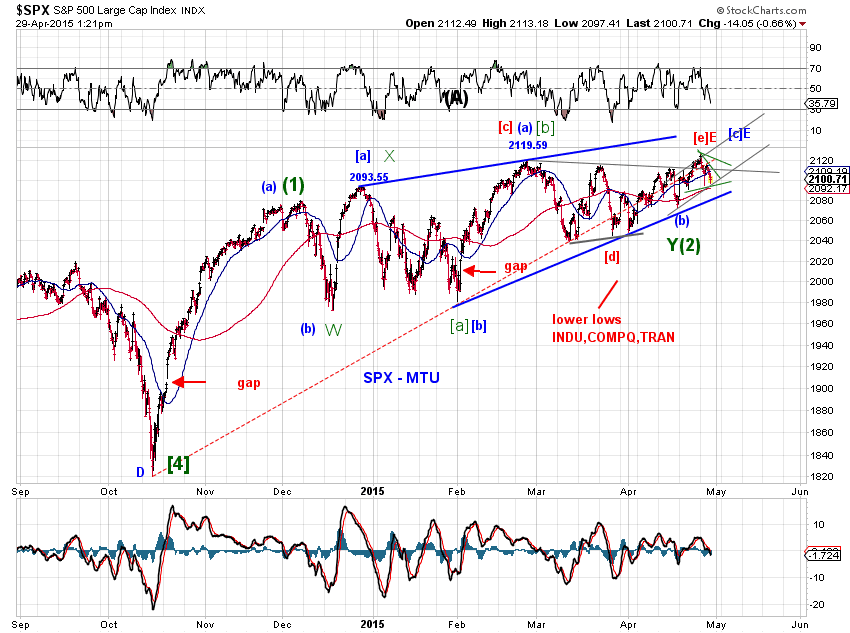
Overhead Resistance (4/10/15)) this past week and pulled back sharply on Friday. SP500 reached a high of 2111.91 on Wednesday but failed to break above its March high, nor its February all-time high. Friday’s low of 2072.37 registered a 1.87% drop from Wednesday’s high. The sell-off has pushed SP500 firmly back into its multi-month consolidation range (Chart 1).

Interestingly, SP400, Russell2000 and Wilshire5000 indexes did achieve fresh all-time highs this past Wednesday. Hence, it’s reasonable to consider Wednesday’s high as either

[bearish] the orthodox high in SP500 if a larger degree down swing has started (Chart 1, red terminal triangle) , OR

[bullish] as the start of a terminal decline in a corrective pullback (e.g. wave C of a downward flat or wave E of a triangle, see Chart 1- blue).

Odds appear to favor the bullish scenario. Consider the following.

Friday’s sell-off represents a downward test of the 50-day moving average of SP500 for the fourth time since its February all-time high, similar to the price actions during the consolidation from November 2014 and February 2015. See the gray circles in Chart 1.

Friday’s emotional and event-driven sell-off is consistent with the personality of wave E of a triangle. Chart 1 also shows how such a triangle fits into the wave structure at one larger degree as

[blue] b-down of (c)-up of [e]-up . Wave c-up of (c)-up is next.

[green] [c]-down of 2-down where wave 2-down is a  [a]-[b]-triangle [c] structure that stock indexes often deliver following the 2009 bottom.

If our assessment of Wednesday’s high is correct, our gap analysis suggest that Friday’s open gap is likely to be filled in the foreseeable future. See past weekly commentaries for details.

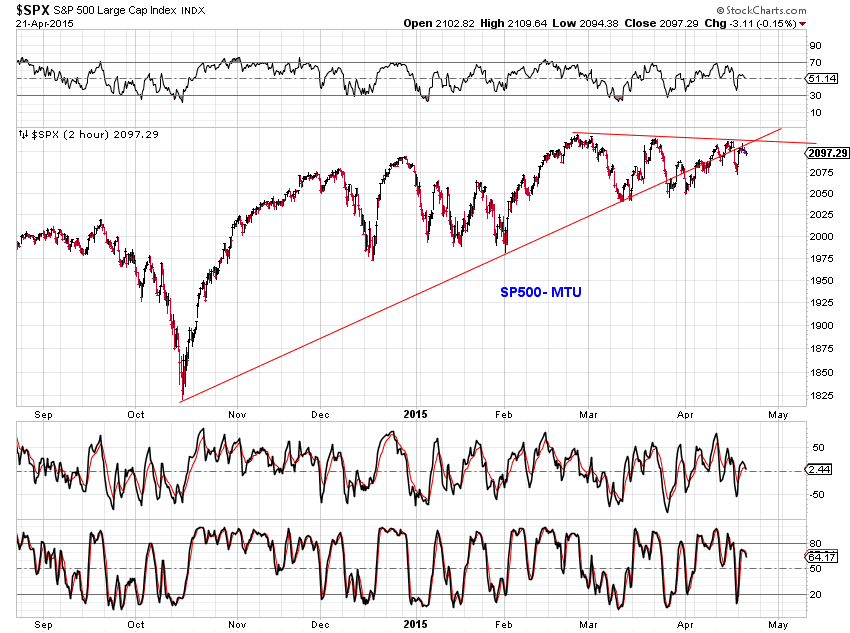
Chart 2 presents the corresponding larger degree tracking counts since the 2009 bottom.


We do note that he bearish scenario with a terminal triangle is quite valid and that stocks are in the time window for a top. See Chart 2 and Overhead Resistance (4/10/15).  A failure of the potential triangle in the bullish scenario above is generally bearish with gaps around 2022 and 1905 becoming vulnerable.  In the very bearish case, perhapsSP500 will continue to track the symmetric price sequence highlighted in Chart 3, where this past week's market top is point 11 in the sequence.


It'll be interesting to see how price actions in the coming weeks, now that the OPEX week is over.

Friday, April 17, 2015

Thursday, April 16, 2015

Market Timing Update (4/16/15)

[EOD] Stocks - As SP500 continues to hug the red dotted line, it will be interesting to see if we end ups with a series of nested wedges/EDTs (red e]E).

[750am] ES update -
ES is probing support. See chart. Yesterday $MID, $RUT, $WLSH made new highs. Odds appear to favor one more high.


Wednesday, April 15, 2015

Tuesday, April 14, 2015

Market Timing Update (4/14/15)

[EOD] Stocks -
SP500 continues to hug the red dotted line (Chart 1). Chart 2 presents squiggles.

[1010am] SPX/ES update -
Tracking the current decline. See charts.

[735am] ES update -
ES probed the green support line overnight. Need to stay above this line for another attempt at the 2107. See chart.