Friday, December 23, 2011

MTU Weekend Ed. - EOY update (12/23/11 Close)

There will be no updates next week. Enjoy the rest of 2011!

SPX closed the week above its 200-day SMA. In addition, INDU rose above its December and October highs. Meanwhile, Nasdaq lagged notably.  And the VIX got "uncomfortably" low.

Chart 1 offers tracking counts which accommodate the current rally as bearish wave C-up or bullish wave 3-up.  On balance, odds appear to favor the bearish count.

The squiggle count puts SPX at the end of wave [iii] or wave (c) up for the Santa rally (Chart 2).


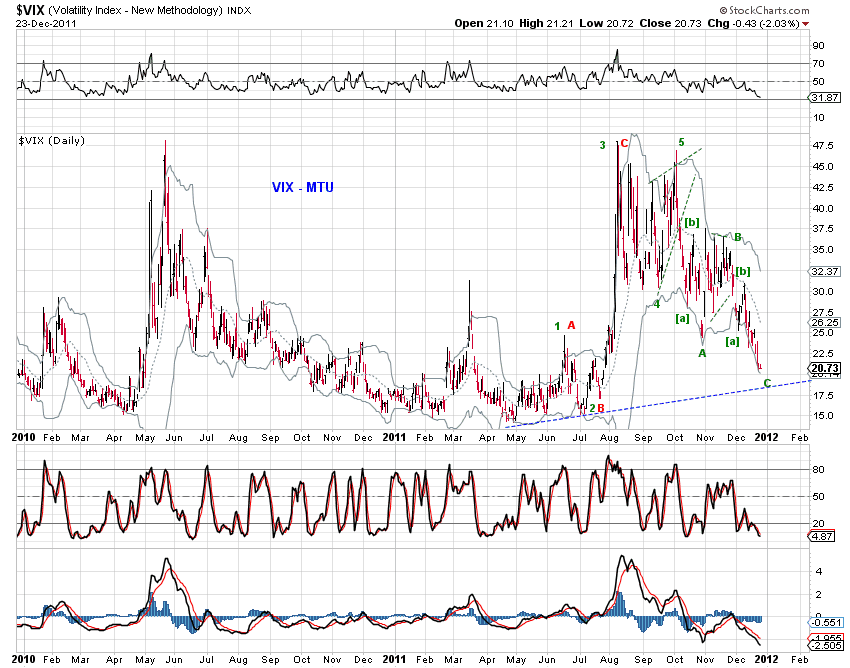
VIX appears to be approaching the end of a double zigzag decline (Chart 3).

Last but not least, the updated chart of triangles of maximum confusion (Chart 4) shows where the market might be if any one of those triangles is playing out.

Market Timing Update (12/23/11)

[1255pm] ES update -
Santa Rally update 2. See 2nd chart below.
[915am] ES update -
Santa Rally update. Let's see if there's follow-through. 


[740am] DAX update -
DAX is not nearly as bullish as ES for the near term, although options exist.

Thursday, December 22, 2011

Market Timing Update (12/22/11)

[EOD] Stocks
See 240pm and 1255pm entries for the large and small time-frame counts - take note of the potential IHS if the rally does not fail. SPX closed just a bit shy of its 200 SMA.

Here's a count on the ES.


[240pm] SPX update
Larger working count, approaching 200 SMA, if the advance doesn't fail, note the potential IHS by the green line. See the 2nd chart below.
[1255pm] SPX update
Moment of truth is upon us. Note the relative weakness of nasdaq but the relative strength of RUT. Also ES is yet to make a higher high at the moment.


[1145am] DAX at the close
DAX at MA50 (chart 1) with a messy near term squiggle (chart 2)


[635am] ES update
Deep retrace. Let's see if it can push to a higher high. It's still in the base channel and within the scope of a wave 2/B rebound. The chart to the right offers the big picture count.


[630am] DAX update
DAX relatively much weaker than SPX/ES in terms of its most recent upward retrace which is still slightly shy of the 0.618 fib (Chart 2).

Wednesday, December 21, 2011

Market Timing Update (12/21/11)

[340pm] SPX/ES update -
On balance, odds favor the expanded flat count (blue) or the more bearish count (red) on the cash SPX. The overnight high in ES is still intact.


[1215pm] DAX, ES update -
Tracking counts, you be the judge. Red, bearish. Blue/Green, bullish.


[830am] DAX, ES update -
Five wave up from the recent low is complete. Let's find out if it is
(1) the end of an expanded flat in DAX and ES or
(2) the 1st wave up of the next swing up or
(3) most confusion, a truncated upswing already

Tuesday, December 20, 2011

Market Timing Update (12/20/11)

[PS] GDOW update -
An update on GDOW for clues. Key observations -
Bullish count (blue) - The triple zigzag as marked is plausible but non-overlapping and slightly odd-looking. Perhaps a zigzag from the orth. high is closer to the truth assuming a corrective decline.
Bearish count (red) - Nine visual and non-overlapping waves down from the nominal high makes a nice impulse wave with an LD wave 1. Wave 2, however, is shallow. Today's rebound is likely A-up.

[EOD] Stocks -
A strong emotional advance today makes an excellent impulse wave (Chart 1, ES, below).As a result, SPX/ES retraced to the 0.618-fib.

SPX ended the day with notable negative divergence with technical indicators as well as with market breadth (Chart 1-ED and Chart 2-SPX, below), implying that a near term pullback is likely.

That pullback will tell us if today's advance is just wave C of an expanded flat (Chart 3-ES to the right, black and purple, Chart 2-SPX, purple, red?).


[325pm] SPX update -
Hitting 0.618 fib retrace. see 2nd chart below.

[1240pm] DAX update -
Initial confirmation of an upswing at 5775.24. The next overlap at 5919.56 to invalidate a 4th wave rebound, Dec high to invalidate a 2nd wave rebound.Let's see if it can.


[940am] SPX squiggles and ES update -
wave 3 off the ES low appears to be extending. Leave room for a rebound in the form of a flat - this could be wave C of that flat.


[635am] DAX, ES update -

Monday, December 19, 2011

Market Timing Update (12/19/11)

[PS] GDOW update -
The following chart refreshes Chart 2 (GDOW) of Make or Break (12/16/2011).
With today's price action,
(red, bearish) Barring a crash, wave 3 does not appear to be extending. So we put a wave 5 around today's low. Note, as labeled, wave 5 cannot extend very far as wave 3 is shorter than wave 1.
(blue, bullish) The best count at the moment is probably a triple zigzag, running out of space at the 1687.64 low.

[EOD] Stocks -
The afternoon plunge pairs nicely with the void in DAX (see 12pm entry).
ES counts as a triple-three or an impulse down, probably complete.
SPX counts well as a triple-three from the orth. high (blue) or a double three from the nominal high (blue).  Bearish counts requires more creativity at this stage (see red and purple) due to the initial overlap.


[12pm] DAX update -
Lower low, adding weight to the impulse decline count. Paris CAC looks worse and London FTSE does not look much better. That said, the minimum requirement for a 1-down or A-down has been met.

see Make or Break (12/16/11) for additional details.

[715am] DAX, ES update -
Corrective count says that a triple-three is complete in DAX and is most likely complete in ES as well with a truncation.
It's possible to count the overnight low as the end of an initial impulse decline from the nominal high in DAX (purple) and ES (red). But one more 5th wave down appears to offer better wave form.

Friday, December 16, 2011

MTU Weekend Ed. - Make or Break (12/16/11 Close)

It's possible to count major stock indexes as being at various stages of an impulsive decline.  While the initial overlap in price structure along the current decline and the lack of notable risk aversion offer prospects of a corrective retrace, stocks are yet to offer confirmation of any sustainable upswing. Global stocks have arrived at a make-or-break point - making it above the December high or breaking the November low, possibly beyond in either direction.

On Dec 12, 2011, we observed: "Looking to GDOW for clues reveals that all (parts of the world) is not well."  Following an additional 4.21% decline over the past week, GDOW apparently has arrived at a make-or-break point.

Chart 1 shows the top bullish (blue) and bearish (red) counts on GDOW since its October low.  More importantly, the squiggle count on GDOW in Chart 2 shows

(1) a completed zigzag correction since the December high on the (immediate) bullish side or
(2) further "immediate" weakness on the bearish side which is at best a wave 5 down or at worst a [iii] of 3 mini "crash". Let's figure out the wave degree afterwards.


One cannot help but notice the high correlation of key global stock indexes.  Like GDOW, major European benchmarks (Frankfurt DAX, Paris CAC and London FTSE) are at various stages of impulsing down on the bearish side or a double three at or approaching completion on the bullish side.  See Chart 3 to Chart 5 and also ... so goes the world (12/9/11).


In the U.S.,  NDX is still leading the slide.  SPX and NDX are yet to offer confirmation of any upswing. See Chart 6 (NDX) and Chart 7 (SPX).


Let's not forget the triangles of maximum confusion discussed in recent weeks (Chart 8) as well as the curious behavior of the VIX (Chart 9).