* Three Waves Down (12/28/18)
* Selloff (12/21/18)
* Range (Busting?) (12/14/18)
* MA Crossings (12/7/18)
* Probing(11/30/18)
* Fresh Closing Low(11/23/18)
* Rolling Over(11/16/18)
* Structure Update(11/9/18)
* Mid-Term Structure(11/2/18)
* Odds(10/26/18)
* 200DMA(10/19/18)
* Big Picture(10/12/18)
* Bull/Bear Tracking(10/6/18)
* Dow vs SPX(9/28/18)
* New High(9/21/18)
* Dow Makes Recovery High(9/14/18)
* 11 Waves Up (II)(9/7/18)
* 11 Waves Up (8/31/18)
* Structure 2 (8/24/18)
* Structure(8/17/18)
* Potential Reversal(8/10/18)
* Potential Reversal Lacking Followthrough(8/3/18)
* Potential Reversal(7/27/18)
* Bear Flag (4)(7/20/18)
* Bear Flag (3)(7/13/18)
* Bear Flag (2)(7/6/18)
* Bear Flag(6/29/18)
* Structure & Gaps(6/22/18)
* Breaking Down?(6/15/18)
* Structure(6/8/18)
* Looming Resolution III (6/1/18)
* Looming Resolution II (5/25/18)
* Looming Resolution (5/18/18)
* Minor Higher High (5/11/18)
* Death Cross Watch 4 (5/4/18)
* Death Cross Watch 3 (4/27/18)
* Death Cross Watch 2(4/20/18)
* Death Cross Watch(4/13/18)
* MA200 (2)(4/6/18)
* MA200 (3/30/18)
* Liberated (3/23/18)
* Squeezed (3) (3/16/18)
* Squeezed (2) (3/9/18)
* Squeezed (3/2/18)
* Rebounding (2/23/18)
* Retrace (2/16/18)
* Reversing (2) (2/9/18)
* Reversing (2/2/18)
* Tracking (1/26/18)
* Channel (1/19/18)
* Fib Tracking (1/12/18)
* Melt up, Blow off (1/5/18)
Monday, December 31, 2018
Saturday, December 29, 2018
MTU Weekend Ed. - Three Waves Down (12/28/18 close)
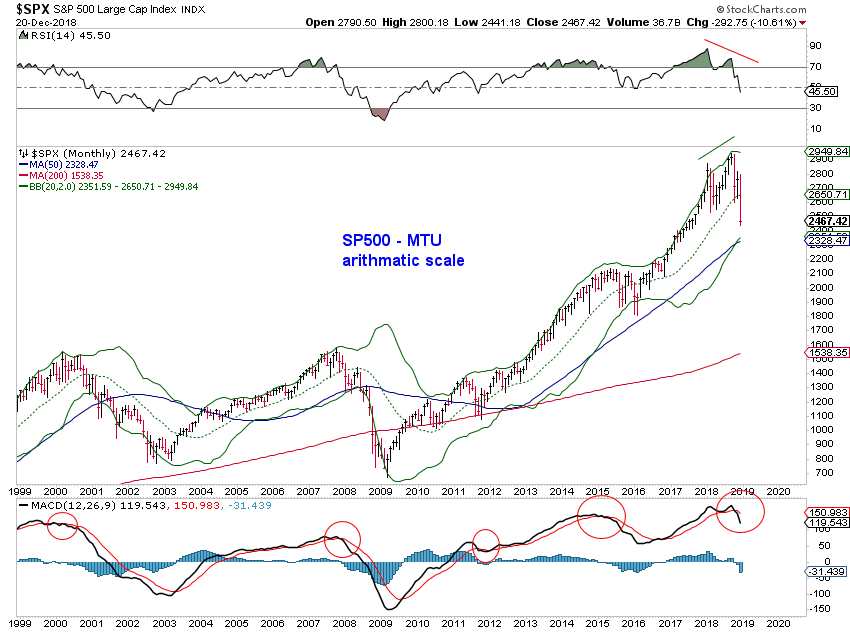
There was significant negative divergence around the all-time high in SPX back in September. A three-wave decline pushed SPX to its lower B-band and 50-month MA this past week. Sentiment shifted with a spike in VIX and price rebounded from technical levels. Watch the mid- and lower- B-bands competing for prices in the near term.
 The MA crossovers (circled in the above chart) suggest potential for deeper and longer selloffs. However, the three-wave sell-off so far counts well as an ABC (Chart 2) decline unless downside momentum picks up very soon (Chart 3).


Thursday, December 27, 2018
Update (12/27/18)
Chart 1 and 2 update the bull and bear tracking counts from the ATH in SPX. Chart 3 updates the recent rather large "squiggles". Please see the Update on 12/24/18 for additional perspective.


Wednesday, December 26, 2018
Update (12/26/18)
Tracking the five-wave decline from the December high in SPX. See yesterday's update for additional perspective.


Monday, December 24, 2018
Update (12/24/18)
A swift sell-off. SPX is now 25 index points away from its lower BB on the monthly chart, and VIX has finally spiked.


Charts below presents the most bullish tracking and how it fits at a larger degree. A parallel tracking places SPX just passed [iii] or near [iii].


Charts below presents the most bullish tracking and how it fits at a larger degree. A parallel tracking places SPX just passed [iii] or near [iii].


Saturday, December 22, 2018
MTU Weekend Ed. - SellOff (12/21/18)
As discussed previously, the loss of the mid-BB in SPX likely make the lower-BB a target (Chart 1).
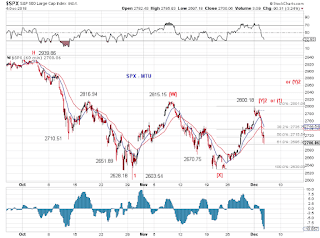
The selloff from the all-time high is three waves so far (Chart 2) and this past week's swift selloff could register as part of the point of recognition if the decline turns out to be an impulse.
Potential small-degree wave pattern completion (Chart 3-4) in SPX and NDX hitting 0-2 trendline suggest a rebound is likely in the foreseeable future.


Thursday, December 20, 2018


Wednesday, December 19, 2018
MTU Wednesday Ed. - Decline (12/19/18)
Key US stock indices are likely at or approaching the lows of an ABC decline from the all-time high or wave [i]-down of 3-down from the all-time high. Oddly, VIX shows only moderate bearish sentiment and risk premia are not rich at the moment - waiting for the red count in Chart 2 or foreshadowing the green count in Chart 2?
SPX


INDU: fresh death cross


NDX
 VIX
VIX

SPX


INDU: fresh death cross


NDX


Tuesday, December 18, 2018
Market Timing Update (12/18/18)
From yesterday's update - "The drop from the 2800 high is so far three waves which presents options as a series of 1s & 2s (most bearish), a diagonal triangle, an ABC (bullish) "
Today's solo lower low in SPX (but not in other indexes) updates

Today's solo lower low in SPX (but not in other indexes) updates

Monday, December 17, 2018
Market Timing Update (12/17/18)
We finally see some downside momentum today as the consolidation range since the October low got decisively busted. However, there is still no real fear basis the VIX index.
The drop from the 2800 high is so far three waves which presents options as
a series of 1s & 2s (most bearish), a diagonal triangle, an ABC (bullish)


The drop from the 2800 high is so far three waves which presents options as
a series of 1s & 2s (most bearish), a diagonal triangle, an ABC (bullish)


Friday, December 14, 2018
MTU Weekend Ed. - Range (Busting?) (12/14/18)
SPX monthly closed below its mid-BB line, eyeing the lower BB line (currently around 2370)
 SPX weekly and daily broke their recent range. But the lack of momentum (so far) for wave [iii] of 3/C-down and the fact that the Dec 3rd high did not make a higher high (especially in INDU) present some flexibility going into the OPEX week, then the holiday week. See the daily chart for bull/bear tracking. Dynamic support is around 2570 (then 2500) and dynamic resistance is around 2670 then 2750.


Thursday, December 13, 2018
Market Timing Update (12/13/18)
SPX cash is still struggling with the green line (discussed yesterday). Overnight futures dipped to probe the blue line. While not required, the form would look better if there is one more higher high for the pink ii or red [b].


Wednesday, December 12, 2018
Market Timing Update (12/12/18)
SPX is probing the green line for support.

Structure tracking update -


Structure tracking update -


Tuesday, December 11, 2018


Market Timing Update (12/10/18)
One more low would look better for the red i-down, perhaps for the green [b]-down too. Not required, but better form.


Saturday, December 8, 2018
MTU Weekend Ed. - MA Crossings (12/7/18 close)
Moving average crossings paint a bearish picture for the intermediate term. Wave structures offer short term flexibility.
The monthly SPX chart shows negative divergence (price vs RSI) against the double top in 2018. The MACD also did a bearish crossing - note the significant weakness subsequent to such MACD bearish crossings in the past (circled). SPX has been probing the mid-BB over the past three months. If the mid-BB support does not hold, the lower BB (currently at 2372) presents a reasonable next-level support.

The weekly SPX chart shows the probing of the lower BB in recent weeks. This past week's candle is not bullish. The rectangle consolidation zone should be monitored.

The daily SPX chart finally did a death cross on Friday. Note the steep decline in MA50 and the weakness in MA200.

Short term wave structures offer some flexibility since this past week's decline is likely a small degree first wave or B wave.

Thursday, December 6, 2018
Market Timing Update (12/6/18)
Chart 1 - Less than 1 index point ahead of a death cross in SPX, bull (green) and bear (red) tracking.
Chart 2 - Squiggles from today's low associated with the bull-bear tracking.


Chart 2 - Squiggles from today's low associated with the bull-bear tracking.


Wednesday, December 5, 2018
Market Timing Update (12/5/18)
How does the plunge in today's ES fit the bigger picture? Bull (green) / Bear (red) tracking.


Tuesday, December 4, 2018
Market Timing Update (12/4/18)
A third failed probe at the MA200 from below in SPX. Less than 6 index points between MA50 and MA200 ahead of a potential death cross against the backdrop a yield curve inversion.

While a triangle is a less likely count, it's rather fitting for a bearish triangle to end on the perceived positive trade war development at G20.
 SPX closed at the low and around the 0.618 fib retrace of its recent upswing. Tracking count

While a triangle is a less likely count, it's rather fitting for a bearish triangle to end on the perceived positive trade war development at G20.


Subscribe to:
Posts (Atom)