Stocks, Bonds, USD, Gold - key intermediate term scenarios to watch
Stocks
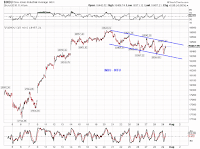
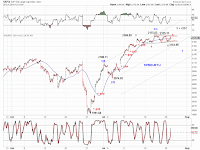
Major indexes have broken out to new all-time-highs or look poised to to so (Chart S1), which paints an overall upward bias for stocks. Price actions are consistent with three key intermediate term trajectories (Chart S2).
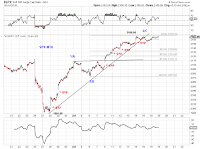
Near term, the visible divergence between the Dow (Chart S3) and SP500 (Chart S4), as well as a spinning top or doji weekly candle in SP500 (Chart S5) deserve some attention.
Bonds
The 10Y US Treasury yield index succumbed to a new record low since its secular high in 1980s (Chart B1). The regaining of the blue line in Chart B2 on a subsequent sell-off was short-lived. If the blue line resistance holds, 10Y yields are on their way to fulfill the head-and-shoulders target.
USD
The lack of upward momentum in the USD index makes the upswing since its May low a potential X wave or 2nd wave rebound (Chart $1).
Gold
Gold has retraced a Fib-0.382 of its 2011-2016 sell-off (Chart G1). Its 2016 high is likely in (blue [v] or green C? in Chart G2) or approaching (green C of an expanding EDT in Chart G2).
Disclaimer: Each post is for informational purposes only. It is not a solicitation, a recommendation or advice to buy or sell any security or investment product. Information provided in each post does not constitute investment advice.
Friday, July 29, 2016
Market Timing Update (7/29/16)
[1140am] SPX/INDU update-
The notable divergence between SPX and INDU (Chart 1) appears to favor the green 4 or the blue [b] (Chart 2).
The notable divergence between SPX and INDU (Chart 1) appears to favor the green 4 or the blue [b] (Chart 2).
Thursday, July 28, 2016
Market Timing Update (7/28/16)
[EOD] Stocks -
SP500 found support right at the EW channel (Chart 1) and hints at a small-degree wave [5]-up (Chart 2).
ES futures continues to struggle against the red wedge resistance (Chart 3). One count from its nominal high suggests (at-least) another leg lower (Chart 4).
[830am] ES update -
ES is struggling to get inside the "wedge". A test of the green line is probable if the red line holds. See chart.
Wednesday, July 27, 2016
Market Timing Update (7/27/16)
[315pm] SPX update -
Post-FOMC tracking. Unless SPX delivers a breakout, there have been lower highs and lower lows since July 20. See chart.
[1140am] SPX update -
Be(a)ware of these potential triangles, follow up and pre-FOMC outlook. See charts.
Post-FOMC tracking. Unless SPX delivers a breakout, there have been lower highs and lower lows since July 20. See chart.
[1140am] SPX update -
Be(a)ware of these potential triangles, follow up and pre-FOMC outlook. See charts.
Tuesday, July 26, 2016
Market Timing Update (7/26/16)
[EOD] Stocks-
Be(a)ware of these potential wedges and triangles. See charts.
[1015am] SPX update-
Tracking the upswing. See chart.
Be(a)ware of these potential wedges and triangles. See charts.
[1015am] SPX update-
Tracking the upswing. See chart.
Monday, July 25, 2016
Friday, July 22, 2016
MTU Weekend Ed. - 2016 Scenarios (7/22/16)
With slightly more than half of 2016 completed, the breakout in SPX in July allows us to track the following three scenarios (Chart 1).
[very bullish - green] A proper impulse wave from the Feb low is developing. Wave 3 is currently in progress and may extend.
[somewhat bullish - blue] A proper impulse wave from the Feb low is completing. Wave 5 is currently maturing (Chart 2). The advance from the Feb low could be just wave 1 of a larger impulse wave or could be the entire upswing.
[very bearish - read] The upswing from the Feb low is actually a three-wave structure. Its wave B is an expanding triangle. The post-triangle thrust, wave C, is maturing (Chart 2).
Thursday, July 21, 2016
Wednesday, July 20, 2016
Market Timing Update (7/20/16)
[1045am] SPX update -
SPX is breaking out with new record highs. Potential small-degree post triangle thrust (blue). See chart.
Tuesday, July 19, 2016
Monday, July 18, 2016
Friday, July 15, 2016
MTU Weekend Ed. - Breakout (7/15/16)
SP500 finally broke out of its 1-year range and closed at new record high (Chart 1). The gappy nature of this breakout suggest either strength or at least near term exhaustion (Chart 2). The prevalence of three-wave structures appears to favor the latter.
Furthermore, the above observation motivates one to keep track of potential intermediate term as well as short term triangles
Potential term triangles (Chart 3).
[green] If the breakout is real, wave [5]-up since the 2009 bottom may be an ending diagonal triangle. The pending high is wave (A) or (C) of the proposed EDT.
[blue] The breakout is wave (B)-up of a triangle, which counts as wave [4]-down since the 2009 bottom.
[red] Wave [4]-down since the 2009 bottom is an expanding triangle. The pending high is its wave(D)-up. Wave (E)-down is next to take out the Feb low.
Potential near term triangles (Chart 4).
[blue] Post-triangle-thrust C-up.
[green] Small-degree expanding triangle [b]-up of B-down.
[red] Terminal expanding triangle C-up.
Thursday, July 14, 2016
Subscribe to:
Posts (Atom)


