Friday, November 30, 2018

MTU Weekend Ed. - Probing (11/30/18 close)

SPX  is probing its SMA200 (2761.88) from below for a third time since its ATH (Chart 1).  There is a cushion of 13 index points ahead of a potential death cross.  Nearby dynamic support is around 2710 and nearby dynamic resistance is around 2770.

There are two potential bearish counts below the early November high, a potential 1-2-[i]-[ii] (Chart 2 red) looks more likely than a potential bearish triangle (Chart 2 blue).

Rising above the early November high would present a potential ABC up from the Oct low (Chart 3).

Chart 4 presents tracking counts (bullish and bearish) in a single chart. 

Wednesday, November 28, 2018

Market Timing Update (11/28/18)

SPX (high=2744 today) is probing SMA200 (2761.54) from below for a third time since ATH.

Friday, November 23, 2018

MTU Weekend Ed. - Fresh Closing Low (11/23/18)

SPX saw its lowest close (2632.56) since it late September peak.  While the Oct 29th intra-day low in SPX is lower, it closed at 2641.25 that day.  SPX is now probing its lower BB band once again (Chart 1).  The potential for a series of 1s/2s decline remains (Chart 2). Dynamic support levels are 2565, 2500, 2430 and dynamic resistance levels are 2725 and 2775.


 This week, the equal-weighted SP500 index joined RUT and MID in making a death cross (Chart 3).

Saturday, November 17, 2018

MTU Weekend Ed. - Rolling Over (11/16/18 close)

The macro environment and market characters are slowly changing for stocks, consistent with a larger-degree correction in stocks.

- US liquidity is being mopped up as the Fed's balance sheet rolls over (Chart 1), somewhat offset by the perceived and actual return of capital and global capital flows at the moment.
- Small-cap and mid-cap indices just saw a death-cross in key moving averages (Chart 2 and Chart 3).
- SPX is struggling to regain its SMA200, and its key moving averages are now sloping down in SPX (Chart 4).


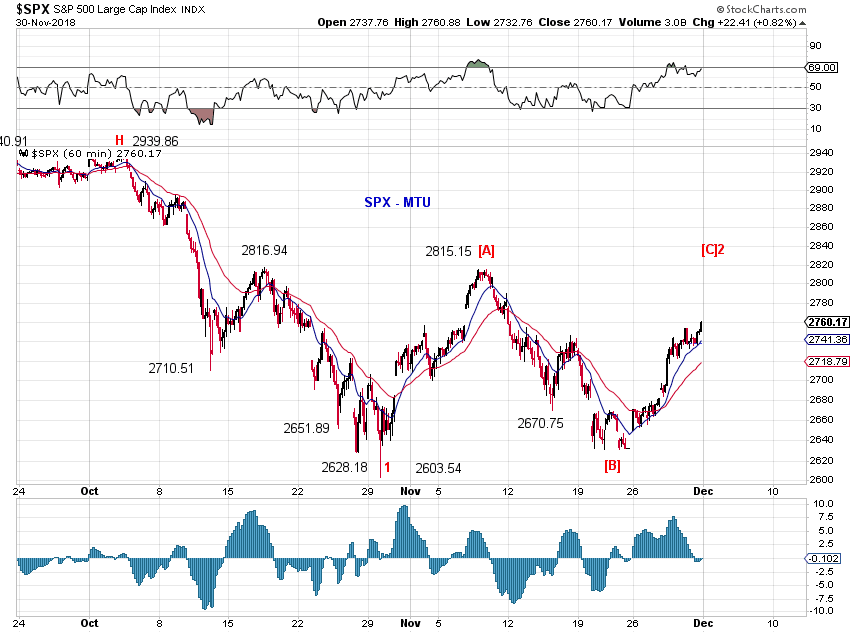
Wave structure in SPX suggests the potential for a series of 1s & 2s down if SMA200 holds.  (Chart 5, blue 1/2/[i][ii])  Dynamic support is around 2565 and resistance around 2785.
Near term squiggle, 

Thursday, November 15, 2018

Wednesday, November 14, 2018

Market Timing Update (11/14/18)

At today's low, SPX likely completed a five-down from its 2815.15 high (Chart 1).  A double zigzag-like structure is the alternative (Char2), but a three-wave rebound from today's low and the ES structure tend to support a five-down.


Tuesday, November 13, 2018

Monday, November 12, 2018

Market Timing Update (11/12/18)

SPX lost its SMA200 again.  Note that both SMA50 and SMA200 are now sloping downward.
The current drop counts well as an expanding diagonal triangle (LDT?) in ES and a regular five in SPX cash.

The following chart show how it fits the bigger picture - see Structure Update (11/9/18) for details.

Friday, November 9, 2018

MTU Weekend Ed. - Structure Update (11/9/18)

SPX retraced to 0.618 of its decline and regained its SMA200 on Wednesday, retested the SMA200 on Friday and rebounded off it.  (Chart 1)
The recent high is likely the first leg of rebound (red [a]) or the wave [c] of an expanded flat (blue 2 or B) (Chart 2).  There are two gaps above and two gaps below.  The nearest dynamic support is around 2733 and the nearest  dynamic resistance is around 2795.


Wednesday, November 7, 2018

Market Timing Update (11/7/18)

SPX regains SMA200 and is eying SMA50 resistance.  At the moment, the upswing from the nominal low counts better as a single impulse than an ABC (Chart 1).  The bigger structure is shown in Chart 2.


Friday, November 2, 2018

MTU Weekend Ed - Mid-Term Structure (11/2/18)

SPX is probing is SMA200 resistance.  The nearest dynamic support is around 2560 and the nearest  dynamic resistance is around 2798.
Mid-term structure, hopefully a picture is indeed worth a thousand words.