Saturday, April 30, 2016

MTU Weekend Ed. - Monthly Outlook Update (4/29/16 close)

Stocks, Bonds, USD, Gold - key intermediate term scenarios to watch

Stocks
Our ABC downswing has likely commenced as SPX has now wiped out its gains in April (Chart S1). Near term support is around 2015. The gray scenario suggests a moderate wave B pullback followed by a wave C upswing to a higher high. The blue scenario suggests a much deeper decline.

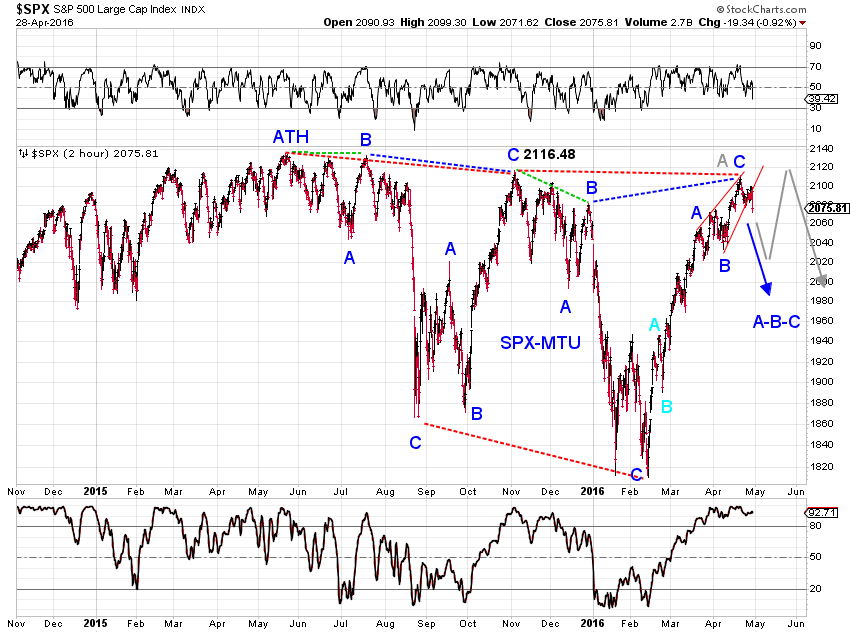
As discussed previously, despite the swift rise in SPX since its Feb low, it's easier to count the upswing as a corrective wave (Chart S2 and S3).

If the upswing is an impulse wave, the April high may only be its third wave (Chart S4 green).

Bonds
The 10Y US Treasury yield index retested the overhead neckline (of a small head-and-shoulders pattern) for a second time and so far has been unable to invalidate the neckline (Chart B1). Our outlook in Monthly Outlook Update (4/1/16) remains applicable.

A large H&S pattern has already lasted about 4 years and targets a new cycle low in long term rates if fully developed. (Chart B2).

Do bond investors know something stock investors have underappreciated or is the bond rally just a manifestation of cheap money?


USD
The USD index continued to decline after some consolidation this past month. The entire drop from its March high looks like a wedge (Chart $1), and the consolidation since its 2015 high looks like a WXY structure (Chart $2). USD strength is therefore likely to surface in Q2.

Gold
After having successfully retested the green wedge support around 1200, Gold rose to 1300 in April and is now poised to take out its 2015 high (Chart G1). We are tracking the downswing from 2011 high with two key scenarios:
[Green] The 2011-2015 down swing most likely ended at the 1045 low. The 2016 rise is wave 1 or A of a new upswing.
[Red] A wave A decline(2011 to 2014) ended at the 2014 low around 1130. An upward expanded flat followed with the 2016 rise as its terminal wave [c].
Near term, Gold is likely wrapping up a fifth wave off the 1045 low (Chart G2-blue) and a retrace to the 1150 area is probable, unless upcoming momentum supports the more bullish interpretation of a wave 3/C (Chart G2-green).


Friday, April 29, 2016

Market Timing Update (4/29/16)

[EOD]Stocks -
Interesting waves and additional technical damage to the upswing. Still 3 waves down to today's low. See charts.


Thursday, April 28, 2016

Market Timing Update (4/28/16)

[EOD] Stocks -
Three wave decline so far from the high (Chart 2),delivering some technical damage to the upswing. See charts 1-4.


[8am] ES update -
ES potentially to probe the blue line and gap SPX down the open. See charts.


Wednesday, April 27, 2016

Market Timing Update (4/27/16)

[EOD] Stocks-
MidCap made a new upswing high, leading or catching up? (Chart 1). SPX near term tracking (Chart 2) and bull/bear tracking of the upswing (Chart 3 and Chart 4).


[1130am] SPX update-


Tuesday, April 26, 2016

Monday, April 25, 2016

Market Timing Update (4/25/16)

[EOD] Stocks -
It is interesting that SPX came close to but was unable to close the downward gap during the day-session (Chart 1) - the gap is closed shortly after the close. It is also interesting to note that the gap is in a location where today's bounce could serve as a kiss of the prior base line IF a meaningful pullback is in progress (Chart 2).  As discussed in ABC-down Looming (4/22/16), near term wave structures can support a minor higher high near term if the market chooses to do - which remains the case given today's price action.


Friday, April 22, 2016

MTU Weekend Ed. - ABC Down Looming (4/22/16)


Momentum of this impressive upswing is now waning and negative divergence is present on the daily SPX chart. We track the recent high at or near the end of a potential ABC-up or A-up (Chart 1). A potential ABC decline is likely looming. The gray path in Chart 1 tracks a small-degree ABC decline, and the blue path a larger degree ABC decline. The 2020/2040 area likely offers (initial) support.


The 30-point drop in SPX this past week presents a potential five-wave decline (Chart 2). Hence, the pullback may be in progress. Confirmation is needed as price patterns can support a minor higher high near term if the market chooses to do so (Chart 3 and Chart 4). Either way, a larger pullback is likely in sight.


Market Timing Update (4/22/16)

[1055am] SPX update-
A visual/potential 5-wave decline in SPX at the moment. See chart.


Wednesday, April 20, 2016

Market Timing Update (4/20/16)

[EOD] Stocks
New rebound high in SPX. Potential small-degree wedge and finishing touches. See charts.

[1135am] SPX update-
SPX continues to subdivide higher. Potential post-(odd-shaped)-triangle thrust? - as one of several interesting possibilities. See chart.


Tuesday, April 19, 2016

Market Timing Update (4/19/16)

[115pm] SPX update-
An overlap of the gray line at 2087.84 increase the likelihood that the current subdivisions since the April low has ended, barring the (less likely) red EDT (Chart 1). Chart 2 presents the larger-degree price profile.

[840am] ES update-
ES bounced off the blue line yesterday, has now exceeded its Nov-2015 high, and bumping against the overhead red line. See chart.


Monday, April 18, 2016

Market Timing Update (4/18/16)

[EOD] Stocks-
potential finishing touches (potential end of 3 or C). see charts.

[905am] ES update-
ES probes the blue line (chart 1) on oil news, completed w4 basis 2026 or incomplete w1/A basis 2081.75 (chart 2). See charts.


Friday, April 15, 2016

MTU Weekend Ed. - Awaiting ABC Down (4/15/16)


The big picture observation in ABC Down (4/8/16) remains applicable. Chart 1 updates. "If the Feb 2016 low around 1810 is to be retested or exceeded (perhaps to conclude wave [4]-down since the 2009 bottom), another ABC type of downswing is a reasonable possibility."

SPX made a new upswing high this past week, making the upswing further mature, as Chart 2 and Chart 3 are tracking.

Chart 4 and Chart 5 illustrate how similar near-term tracking work on the Dow and the MidCap index.