Friday, July 31, 2015

Thursday, July 30, 2015

Market Timing Update (7/30/15)

[EOD] Stocks -

[830am] ES update -
Several corrective wave structures raise the possibility of the bullish gray terminal triangle in Chart 1, among other possibilities. Squiggles in Chart 2.


Wednesday, July 29, 2015

Market Timing Update (7/29/15)

[EOD] Stocks -
An emotional market makes better-formed waves. See charts.

[1215pm] SPX/TRAN/INDU update -
Pre-FOMC, SPX is approaching potential resistance (Chart 1). Transports are showing relative strength (Chart 2). Tracking the current upswing to new highs or as a corrective rebound as marked.


Monday, July 27, 2015

Market Timing Update (7/27/15)

[EOD] Stocks-
Several indexes have now broken below their July lows (Chart 1).

Squiggles place SP500 at a potential a small-degree 4th wave rebound (Chart 2), which fits into the gray wave (c) of [d]-down OR the red wave (i)-down at a larger degree (Chart 3).

[740am] ES update-
Overnight sell-off in ES to complete ABC or 123 as marked. See chart and weekend commentary for details.


Friday, July 24, 2015

MTU Weekend Ed. - A Tale of Benchmark Indexes (7/24/15)

Stocks broke July's unsustainable momentum and dropped sharply this past week.

Notably, the SP400 mid-cap index and the Russell 2000 small-cap index have already broke their July lows (Chart 1).


Meanwhile, after a parabolic rise with unsustainable momentum (see Tech "mania" (7/17/15)), NDX is down about 3% over the past week, in what appears to be an island reversal, and filling two prior upward gaps (Chart 2).  Near term upside potential includes an attempt to fill the downward gap or this past week's pullback being a (suspect) small-degree fourth wave.


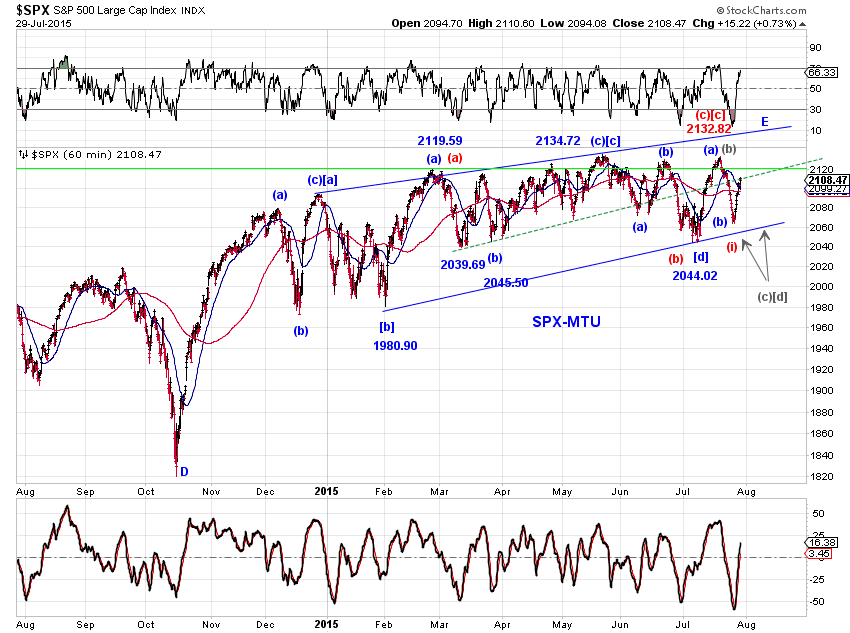
The pullback is anticipated by our base case scenario as wave (b)-down of E-up (Chart 3 and Chart 4). At the moment, SP500 appears near term oversold and is also approaching potential support. Under this interpretation, wave (c)-up is insight to push SP500 to new highs.


However, the lower lows in MID and RUT and a very deep pullback in the DOW raise the possibility that the current pullback is completing wave [d]-down which commenced at the May high (Chart 3 gray [d]). Under this interpretation, once wave [d]-down concludes, wave[e]-up should push SP500 to new highs.

On the "very" bearish side, the red tracking count in Chart 3 highlights the possibility that a double zigzag (not an EDT) wave E-up since the 2014 wave D-down low is complete at 2132.82.


Market Timing Update (7/24/15)

[740am] ES update-


Wednesday, July 22, 2015

Market Timing Update (7/22/15)

[EOD] Stocks -
Gap-fill time.

[8am] ES update -
Pullback in progress, gap-fill time. See charts for tracking counts.


Tuesday, July 21, 2015

Market Timing Update (7/21/15)

[EOD] Stocks -

[1150am] SPX update -
SPX retested the red breakout line (Chart 1) and is now trading below it. If the tracking count in Chart 2 plays out (see yesterday's EOD update), a decline to 2100/2100 appears likely.


Monday, July 20, 2015

Market Timing Update (7/20/15)

[EOD] Stocks -
SP500 is very close to make a new all-time-high (Chart 1). Chart 2 offers tracking squiggles of the current upswing. A potential five-wave advance from the July 8th low is likely concluding.

[Blue count] Note the alternation in price and time of wave (ii) and wave (iv). Also note that wave (i)-to-(iii) roughly divides this advance into a 1.618 Fib ratio / extension.

[Green count] tracks a potential small-degree EDT which anticipates a higher high (which incidentally would be a new all-time-high for SP500).

Also see Tech "mania" (7/17/15) for additional discussion.


Sunday, July 19, 2015

MTU Weekend Ed - Tech. "mania" (7/17/15 close)

Stocks have staged an impressive recovery from their July lows. SP100 and the Nasdaq Composite made new all-time highs and the Nasdaq 100 Index made new recovery highs. For the intermediate term, odds cwontinue to favor the wave E-up (our base case) in SP500 (Chart 1), and to a lesser extend,  an even bullish wave 3 (Chart 2).


Near term, stocks appear overbought, especially in NDX, where four upward open gaps currently exist (Chart 3), against visible weakening in its internals (Chart 4). 


Our tracking wave count place the pending high in NDX at  wave 3 or wave C off its financial crisis low. See Chart 5 and Chart 6.  A meaningful pullback is likely in sight.


Friday, July 17, 2015

Market Timing Update (7/17/15)

[803 am] ES update -
See yesterday's EOD update for comments. Also note three open gaps so far for this upswing.


Thursday, July 16, 2015

Market Timing Update (7/16/15)

[EOD] Stocks -
SPX is likely completing a five-wave advance from its July 8th low, with momentum befitting a third wave or a C wave (Chart 1). The blue E wave in Chart 2 tracks the current advance well.

Note the divergence among indexes: NDX made a higher high, but MID, RUT and TRAN were relatively weak.

If the market decides to reverse here, SP500 did meet the minimum requirement of the red count in Chart 2, although wave [c] appears too small in both time and price.


[820 am] ES update -
New high in NQ. ES made a brief retest of TL and rebounded, now approaching the next overhead TL. See charts.


Wednesday, July 15, 2015

Market Timing Update (7/15/15)

[825am] ES update -
ES solidly above several prior resistance. A retest looks likely based on squiggles. See charts.