Stocks, Bonds, Dollar, Gold
Stocks

As these gaps reside in a potential wave one instead of wave three, history suggests that they get filled relatively soon.
However, the 1680 gap is now 12 trading days old, well beyond the longevity of downward gaps since the 2009 market bottom, demonstrating the underlying weakness in stocks and suggesting a potential trend change. For details, please see This Gap is Different (8/23/13).
To reconcile these aspects, we make a logical conclusion that the current sell-off is (a) the beginning of a extremely powerful bear market in stocks (given the location of the breakaway gaps) OR (b) wave C of a (sideways) correction (not wave A). Odds appear to favor a gap-fill rebound or the bullish count at the moment.

In other words, we are tracking two key scenarios:
(a) a major top in early August (see red counts in Chart 2 to Chart 6) since these gaps are different. OR
(b) a sideways correction since the May top in broad market indexes and since early August in NDX. In this case, the correction best counts as a fourth wave. See green counts in Chart 2 to Chart 6. This scenario presents the potential for the following wave five to be more comparable with wave one from a duration perspective (i.e. in time).
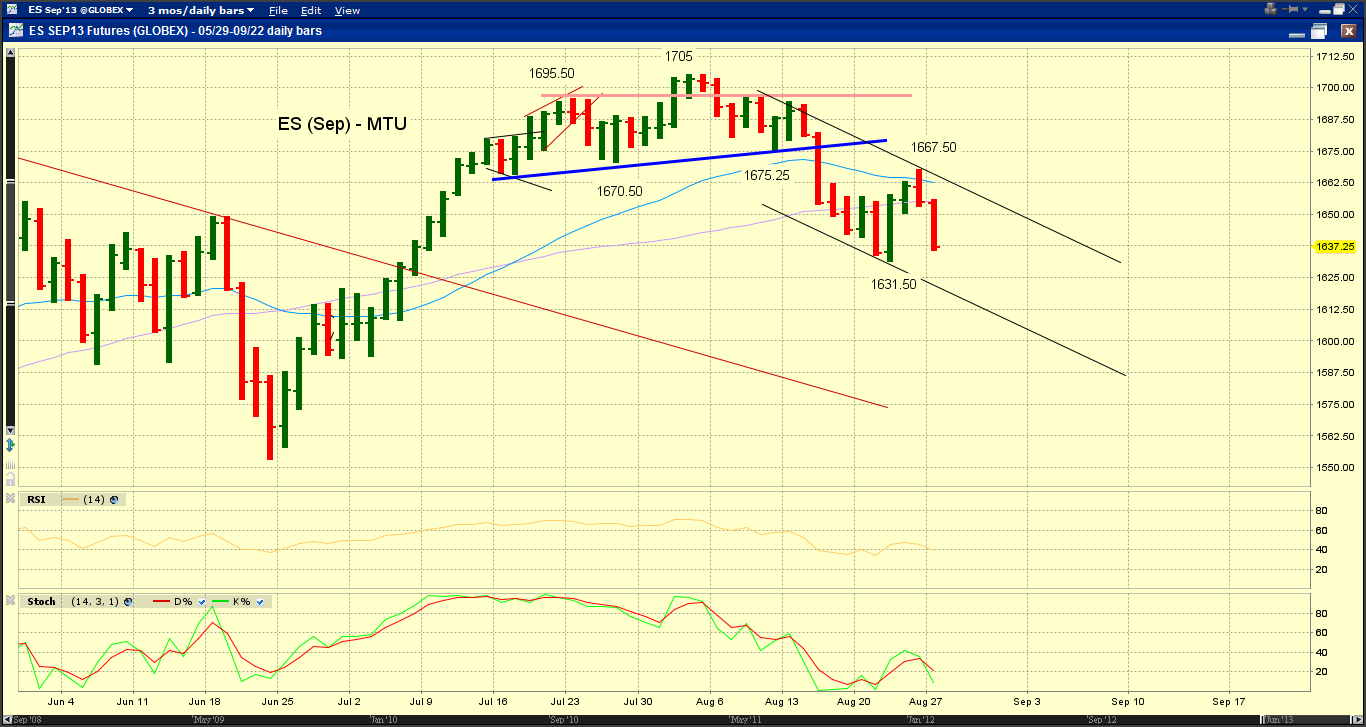
SP500 tracking


NDX tracking


Bonds
The 10-year Treasury yield has likely completed the first three waves of an impulse or an ABC structure since its 2012 low (Chart 7). A retrace to 2.5% and beyond appears likely.
Our long term count places the near term high at the initial third wave of a new bear market for bonds (Chart 8, green) or wave D of the final subdivision of the 30+ year bull market in bonds (Chart 8, blue).
It's interesting to note that 10Y yields are also at the 2003 and 2009 pivot lows (Chart 8).


Dollar
Our long term count on the US Dollar index has not changed (Chart 9). Price actions are in line with our expectation that the USD index remains range bound for some time as indicated. Wave structures since the 2011 low in the dollar (Chart 10) suggest that we are likely to see a low below the August low first before a high above the July high.


Gold