Monday, May 30, 2022

MTU Weekend Ed - A Potential Impulse (5/27/22)

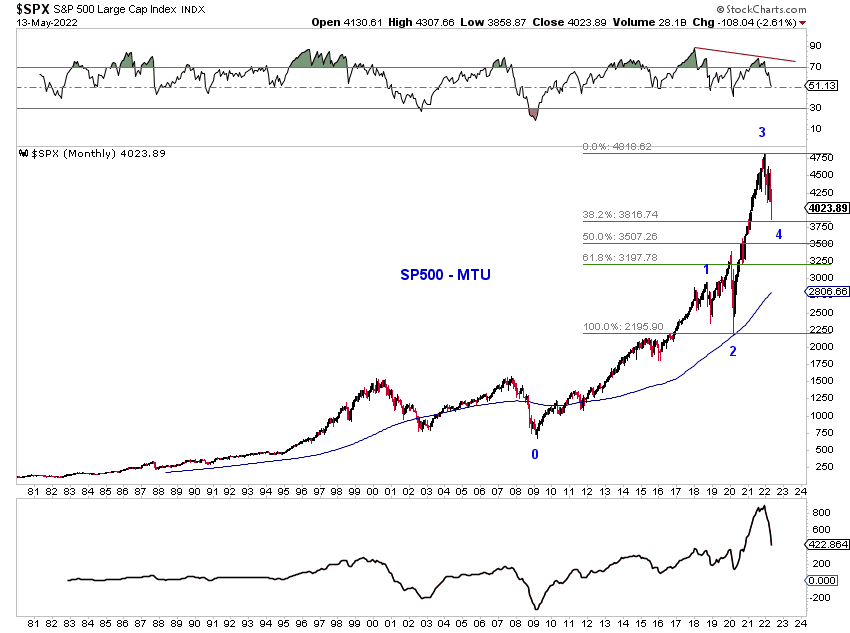
A potential impulse may be developing in SPX from the low (Chart 1), potentially to launch wave five up (Chart 2) highlighted in recent weeks.  Note that wave four down, if complete, retraced a fib-0.382 of wave three up. 

Can it be a bull trap, at least for the short term? Yes and time will tell.  By measurement, a potential expanding (solid red line) or contracting (dashed red line) diagonal triangle is a possibility  (Chart 3).  


Saturday, May 21, 2022

MTU Weekend Ed - A Potential Low (5/20/22)

SPX made 3 large waves down from its 1/4/2022 ATH (4818.62) to Friday's low (3810.32), netting a loss of 20.925%. The internal price structure appears corrective. There are several ways to count it and many which are near mature.  As such, there is potential for a near term low. See Chart 1. 

If the 20% drop is indeed a larger wave 4 pullback discussed in last week's post, there is also potential for an intermediate low. See Chart 2.  

If the top is in, price should negotiate lower with momentum eventually.  Time will tell.


Saturday, May 14, 2022

MTU Weekend Ed. - Wave Four (5/13/22 close)

Based on the steepness of the advance since the 2020 low and the corrective pullback from the 2022 high, the possibility of a fourth wave looks reasonable and interesting.  This structure is more obvious on a arithmetic-scale chart of SPX.