Friday, September 28, 2012

MTU Weekend Ed. - Rebound (9/28/12 Close)

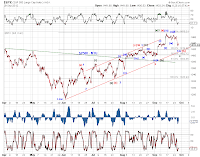
Countdown (9/21/12) proposed a logical spot for a top ( black point number 5 in our Hope Rally model, Chart 1) if a small-degree 5th wave at that time did not extend further.  We observed that “while there are other ways to count the advance as incomplete, a breach of Thursday's low (1449.98 in SPX on 9/20/12) is likely a bearish indication at a larger degree.”

A week later, SPX did breach 1449.98 and has made further progress to the downside (to as low as 1433.32) and the Dow closed solidly below the upper trend line of a proposed EDT/wedge in what appears to be a five wave decline from a truncated high (Chart 2, red).

So trend-reversal watch is on.


However, price structures of the decline across leading indexes also suggest the possibility of a corrective pullback. For example,
[1] From the orthodox high, SPX fails to make a lower low on Friday to complete a five-wave decline, presenting a potential bullish divergence.
[2] From the nominal high, the Dow has so far traced out a corrective flat decline, the SPX a double three pullback and NDX a zigzag sell-off.

So the jury is still out regarding a trend reversal until further development. But a near term rebound is likely in progress or in sight.

The best candidate for a corrective decline would be a 4th wave correction with uncertain degree (Chart 2 INDU -blue and green, Chart 3 NDX - blue and green). Whether it is wave 4 or wave [iv] of wave 3 depends on how much one rushes his count. And the correction is likely approaching its end.

The second best candidate for a corrective decline would be the decline toward black point number 6 in our Hope Rally model (Chart 1). In this case, the correction is likely far from over.

Finally, Chart 4 updates the advance/decline line associated with SP500. The current sell-off has taken its toll on market internals.


Market Timing Update (9/28/12)

[145pm] SPX squiggles -


[1005am] SPX update -


[845am] ES update -
Month end, quarter end, full moon.


Thursday, September 27, 2012

Market Timing Update (9/27/12)

[EOD] Stocks -
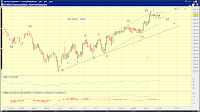
The proposed rebound came. It is so far a three wave structure, but impulsive looking. See Chart 1 to the right.

Chart 2 updates the larger count. Chart 3 presents these counts on the squiggle level.
Bullish (green) - wave 4-down is either over or yet to see [y]-down of a [w][x][y] decline.
Bearish (red, blue, purple) - an LDT decline or a series of 1s2s down .


[1250pm] SPX update -
The proposed rebound in SPX came this morning. Let's see if it is a bearish wave X-up (or to a lesser extent a bearish 4th wave up) or the start of the proposed 5th wave advance (or the final [c]-up) since the June low (see this chart).


Wednesday, September 26, 2012

Market Timing Update (9/26/12)

[EOD] Stocks -
A near term rebound is likely in sight. Chart 1 and Chart 2 update the top tracking counts since the June low in SPX and INDU - trend reversal or a 4th wave correction. The 2nd chart below updates the squiggle count from the high (or orth. high).


[1120am] SPX squiggles -
SPX approaching potential 4th wave support. We'll show the larger structure after the close.


[925am] ES update -
Two tracking counts.


Tuesday, September 25, 2012

Market Timing Update (9/25/12)

[EOD] Stocks -
Chart 1 updates the larger count on SP500, which now tracks (1) the bearish change of trend off an orthodox high (blue) and (2) the bullish count(s) of a wave [iv] (green) or wave [b] decline (red). A decline below 1426 invalidates the proposed wave [iv]-down but not (yet) the proposed wave [b]-down.

Chart 2 tracks the bearish squiggles and Chart 3 tracks the bullish squiggles.


[1pm] SPX update -
Potential triangle as discussed in yesterday's EOD update. Let's see if it is viable.


[9am] ES update -
Potential for further subdivision higher if one does not rush the count in ES.


Monday, September 24, 2012

Market Timng Update (9/24/12)

[EOD] Stocks -
Chart 1 presents the tracking count since the June low, the advance toward the black point #5 in our Hope Rally model.
Recent sideways move is now too lengthy in an ideal situation to be blue wave [iv] and the retrace from Friday's high too deep in an indeal situation to be blue wave (ii) of [v]5 - although respective EWP rules are still satisfied.
Thus, if the market continues to move sideways, one should overweight the more bullish count green count where wave 3-up off the June low is extending and [iv]-down of 3-up is in progress in a potential triangle/double three formation.

Chart 2 counts the bearish case from the recent orthodox high.
[

815am] ES update -
Deep retrace in ES. Wave[iv] could still be in progress, A - expanding triangle B - C (Chart 1). Otherwise, swing down at a larger degree, either a trend change (black point #5 in our hope rally model - see Countdown (9/21/12) ) or wave [iv] of an extended wave 3 off the June low (Chart 2).


Friday, September 21, 2012

MTU Weekend Ed. - Countdown (9/21/12)


Our assessment of the evolution of the Hope Rally, such as that outlined in Are we there yet (9/14/12) and in past weekend commentaries, has not changed.

The decline into Thursday’s low (1449.98 SPX) likely concluded a small degree wave [iv]-down as tracked by the blue count in Chart 2 in Are we there yet (9/14/12). Chart 1 below updates. A terminal wave [v]-up is likely in progress - barring a severe truncation (see EDT tracking in the Dow below) . In other words, the market is in a countdown towards the black point number 5 based on our Hope Rally model (Chart 2).  An interim high (and potentially a major high) is likely insight.


Interestingly, it is easier to track the very near term wave structure in futures (ES). The sell-off into Friday's close retraced the rebound from Thursday's low and approached potential trend line and Fib support (Chart 3 and Chart 4).  It counts as (ii)-down of [v]-up based on the bullish count (black), and the start of iii-down based on the bearish count (green) or i-down (black-alt).


It's also important to update the potential bearish EDT we have been tracking in the Dow.  Chart 5 shows the proposed EDT has already satisfied an overthrow.   If the final small-degree 5th wave does not extend, the market has already turned.  Meanwhile, the AD line associated with SP500 still diverges negatively (Chart 6). Hence, while there are other ways to count the advance as incomplete,  a breach of Thursday's low is likely a bearish indication at a larger degree. 


Market Timing Update (9/21/12)

[10am] SPX update-
Tracking counts on SPX and a potential overthrow in INDU.


Thursday, September 20, 2012

Market Timing Update (9/20/12)

[EOD/330pm] Stocks -
The proposed small degree 4th wave pullback is likely complete. See charts.


[940am] SPX update -
near term tracking counts, see chart.


[815am] ES update -
It appears to be a post triangle thrust down in ES overnight. see chart.


Wednesday, September 19, 2012

Market Timing Update (9/19/12)

[EOD] Stocks -


[855am ] ES update -
ES is lagging behind both YM and NQ, leave room for extension, truncation or a more complex correction.