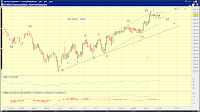
 Chart 1 updates the larger count on SP500, which now tracks (1) the bearish change of trend off an orthodox high (blue) and (2) the bullish count(s) of a wave [iv] (green) or wave [b] decline (red). A decline below 1426 invalidates the proposed wave [iv]-down but not (yet) the proposed wave [b]-down.
 Chart 2 tracks the bearish squiggles and Chart 3 tracks the bullish squiggles.


[1pm] SPX update -
Potential triangle as discussed in yesterday's EOD update. Let's see if it is viable.
[9am] ES update -
Potential for further subdivision higher if one does not rush the count in ES.

