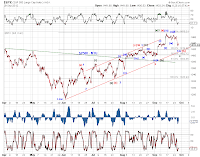
A near term rebound is likely in sight. Chart 1 and Chart 2 update the top tracking counts since the June low in SPX and INDU - trend reversal or a 4th wave correction. The 2nd chart below updates the squiggle count from the high (or orth. high).


[1120am] SPX squiggles -
SPX approaching potential 4th wave support. We'll show the larger structure after the close.


[925am] ES update -
Two tracking counts.

