It's possible to count a completed five up from the Nov low (Chart 1, blue) and completed small-degree five-down from today's high (Chart 2, red).
Then again, squiggles are squiggles, a double zigzag is missing a final C-up (Chart 1, red), and an extended wave v is missing waves [3][4][5] (Chart 1, blue).
However, note the deteriorating breadth along surge from the Nov low (Chart 1, bottom panel). This leg of advance is running out of steam.

[1150am] DAX update at the close -
Potential triangle intact. Let's see which way it breaks. Moment of truth - till tomorrow. See the 2nd chart below.
[10am] Transports update -
Most bullish count of the recent surge is 1-up (blue) or A-up (purple). Most bearish count of the recent surge is C-up of an expanded flat (red) with Oct high surviving. Can map into SPX.


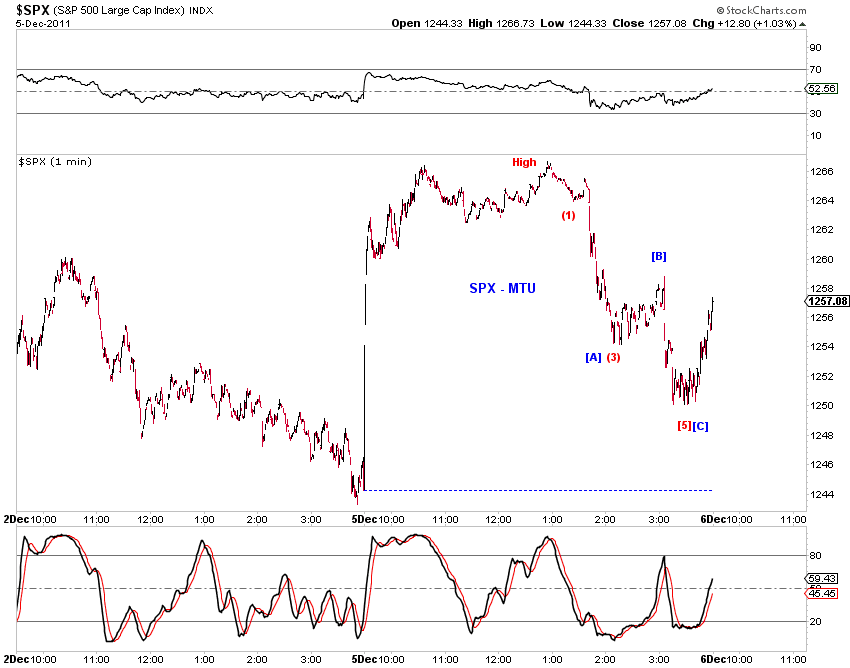
[935am] SPX squiggles -
see the 2nd chart blow.
[857am] ES squiggles -
Especially if it should reverse around here. Also consistent with a potential barrier triangle outlined in the 645am entry, or a flat wave [b]/[ii] correction.


[645am] DAX, ES update -
Potentially larger triangles in both.

