Large cap U.S. stocks have now broken out of a two-week consolidation area (Chart 1, gray circle) while the rest of the market (mid-cap, nasdaq, russell small cap and transports) have lagged somewhat. More interestingly, SP500 is now making its third attempt to break above its long term resistance zone (Chart 2). A meaningful upswing is likely to follow should the breakout be successful.


 Inside Week (5/25/12) ( longer term thoughts section ) highlighted a potential triple-three structure of the Hope Rally and stated that odds favor further upside potential for stocks. In this case, the June low is likely the black point number 4 in Chart 3. While we still cannot rule out a retest of the June low (see below), we do not expect a much lower low if the green or blue counts in Chart 3 are on track.
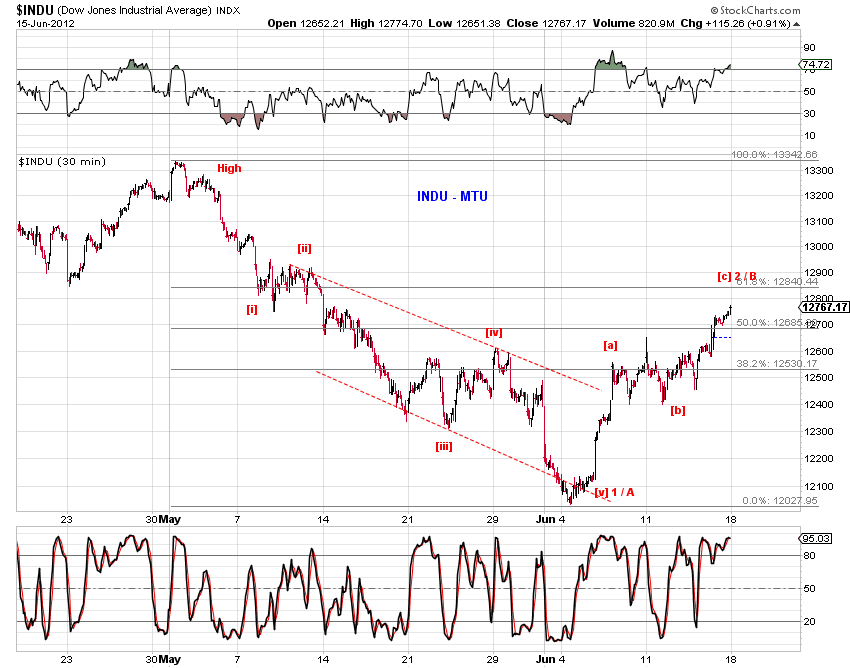 From a bearish perspective, Chart 1 shows that SP500 is now testing its prior channel support which is now resistance. Moreover, in a three wave structure so far, the Dow has now retraced about 60% of what appears to be an impulse wave decline from its nominal high, its May high (Chart 4). The usual requirement of a wave 2/B rebound has been met in price, wave structure and time. Expect a wave 3/C decline to lower lows under this scenario - but the current breakout must fail first.