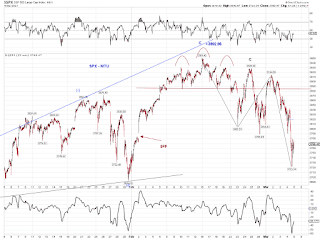
Three waves down so far from he ATH (blue C) or a potential failure high (green C) discussed before (Chart 1).
SPX closed at a couple of trend-line support levels and is yet to break the late Jan low. On support failure, SPX has potential to hit the 200DMA, currently around 3465 (Chart 2).


CHART 1 - note that from 8 Jan to end of Jan there appears to be a neg 5 wave seq inside an expanding triangle.
ReplyDeleteThere is same deg neg 5 down from 12 - 23 Feb. You should be able to work out what else is there.
what do you mean by neg 5 wav seq? wave 2 breaches wave 1 high? thanks
Delete