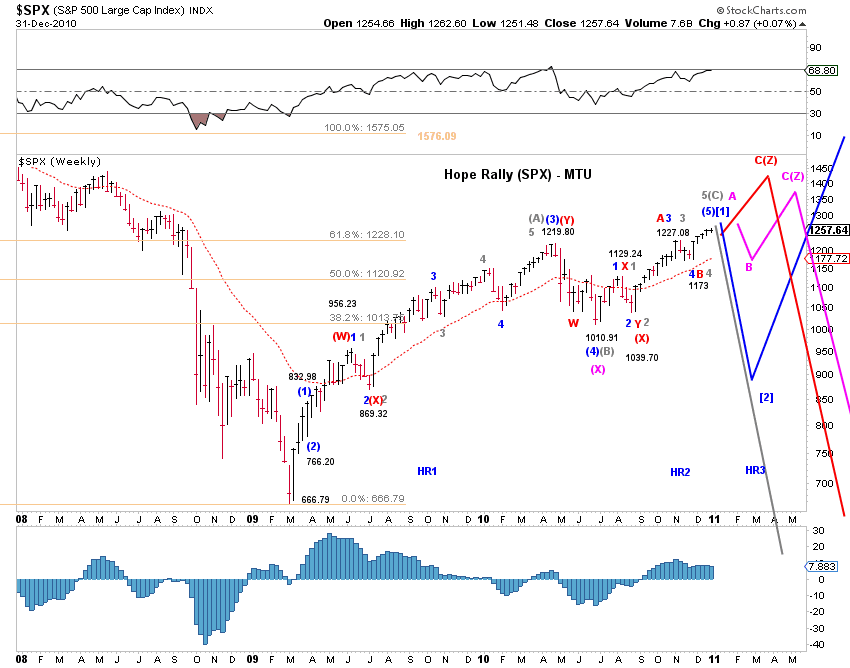
As 2010 transitions into 2011, an update on the Hope Rally is appropriate. For a more in-depth discussion of the Hope Rally, please see Hope Rally Update (12/3/10). Chart 1 updates the top four scenarios (wave counts) that describes the stock market trajectory and projections into 2011. Here's a summary of these scenarios and the associated (subjective) probabilities.
Scenarios / Wave Counts
[Blue - long term bullish] Based on this count, the end of the current advance, likely in early 2011, is the end of primary wave [1]-up of a new multi-year bull market. A deep wave [2]-down correction is likely. The subsequent wave [3]-up advance will push the market to new highs. Targets for the top is around current levels or around 1290 in SPX.
[Red and Pink - long term bearish] Based on this count, the Hope Rally has additional upside potential in price as well in time. A near term pullback is likely. The difference between the two scenarios is whether the proposed near term pullback is (very) shallow (Red) or meaningful (Pink), as illustrated in Chart 1. Targets for the top is around 1350.
[Gray - long term bearish] Based on this count, the end of the current advance, likely in early 2011, is the end of the rebound. The bear market that resumes will likely push the market to below the 2008-2009 low.
[Other - long term range-bound] Another possibility is a drawn-out side-ways market with a relatively large range.
Subjective Probability
The long term bearish counts, collectively, are moderate more likely than the long term bullish count (gray) outlined above.
Between the bearish red and pink counts, the pink count is moderately more likely than the red count.