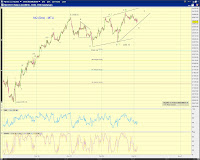
Primary count is [ii]-down of 3-up under the bullish count and at least a near term trend change under the bearish count (Chart 1). Squiggles show a five wave decline from the recent high (Chart 2).


[255pm]SPX squiggles -
Could be looking at another bearish triangle if the low is not in.

[1230pm]NQ update -
 EWP to be saved by a potential EDT? Here's how the potential EDT fits into the larger count (Oct 27, 2011 update).
[1150am]DAX update -
gap fill, close to negate a potential 4th wave, but still above TL support.

 [840am] JPY, ES, DAX update -
 BoJ intervention, large moves in USDJPY and DX. Chart 1 shows the mixed performance following the previous interventions in 2011. We'll find out if this one sticks.
Moment of truth for ES based on various counts. Is this a 4th wave or something more bearish? Watch the 1254.50 level (Chart 2).
DAX finds it in a similar situation on the squiggle level, but is relatively more bullish one degree higher (Chart 3).
Thus, if the bearish count is playing out, leave some room for a complex (double zigzag or complex three) wave (2)/(B)-up rebound in ES, as discussed in Points of Recognition (10/28/11).

