Chart 1 (SPX) and Chart 2 (INDU) shows the market at [ii]-down of C-up or a completed but rather small (in price as well as in time) wave C-up. The decline is a three so far with stakes on the euro area news tomorrow. INDU is right at its IHS neckline again.

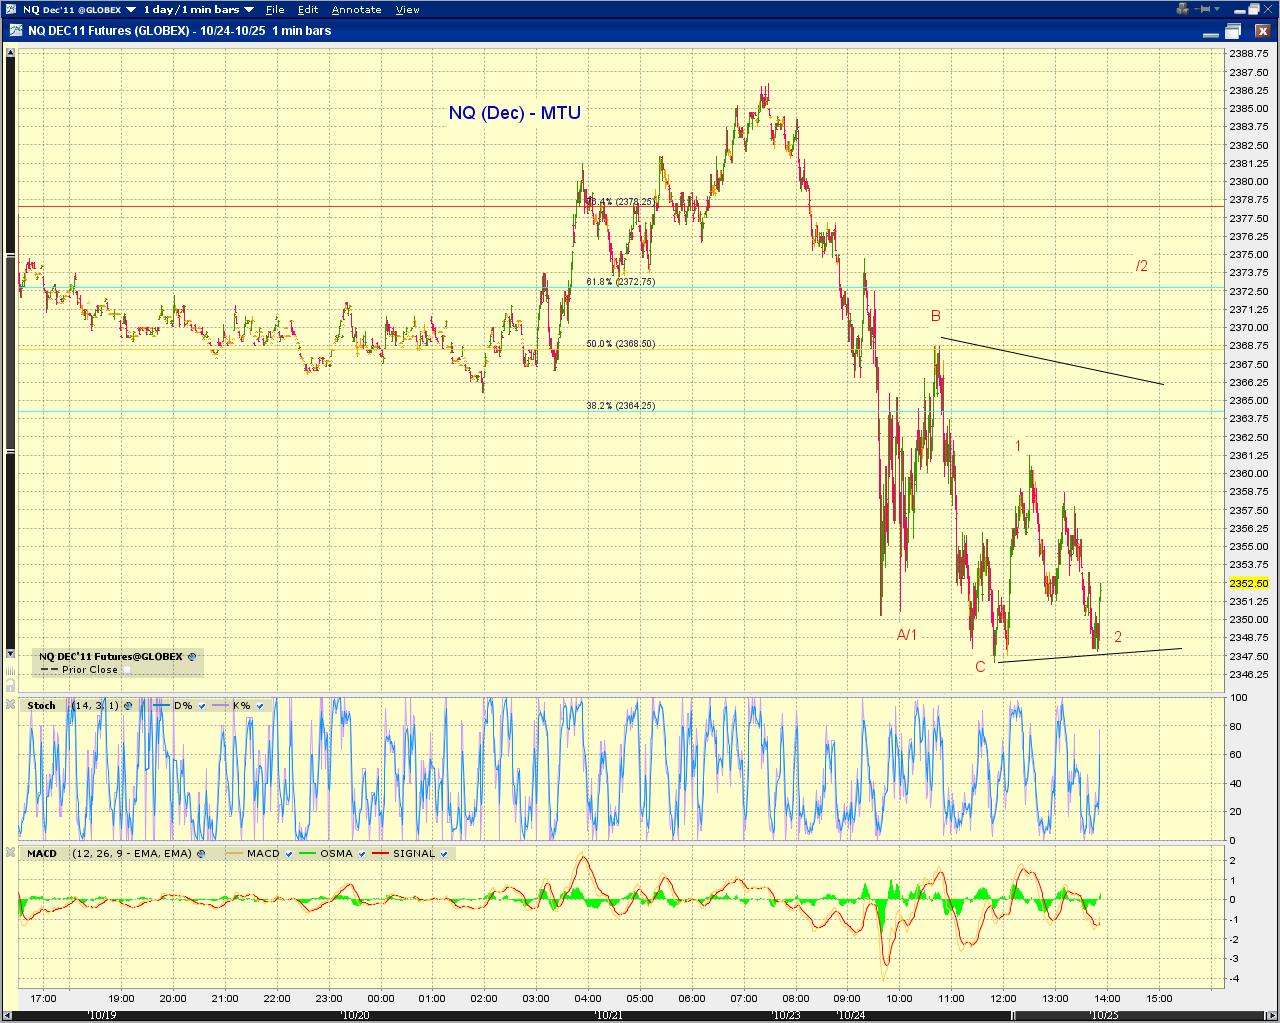
 Chart 3 and Chart 4 present the tracking count on NQ, which so far has failed to make a higher high beyond the October 17th high. The decline is also a three so far.
 [215pm] NDX/NQ update -
Here's a working count if the market rallies up from here. see 2nd chart below
[150pm] NDX/NQ update -
Here's a working count if the market rallies up from here.

[1230pm] DAX update -
Leave some room for the possibility that DAX could be extending if headlines does not disappoint, given the squiggles and the relative small size of wave 3 as labeled. see the 2nd chart below.
[1005am] SPX update -
tracking counts, green B is a key level for C/3-up.

 [840am] ES, NQ update -
ES - higher high overnight, turning down at the moment
NQ - still less than 2 points shy of a new high, turning down at the moment

 [740am] DAX update -
Higher high in a decent 5-wave advance. Is the pending high the end of a zigzag (RED) or the end of the first wave up (BLUE)?

