Please see Let's Recount (11/5/10) for a discussion about the wave structure since the March 2009 low, and Let's Recount II (11/12/10) for a discussion about the wave structure since the Y2K peak.
[Near Term Stocks]
 What do you think of this count on the FTSE and the DAX mapped into SPX (Chart 1a 1b and Chart 2)? If so, leave room for an extended fifth wave in addition to bearish counts.
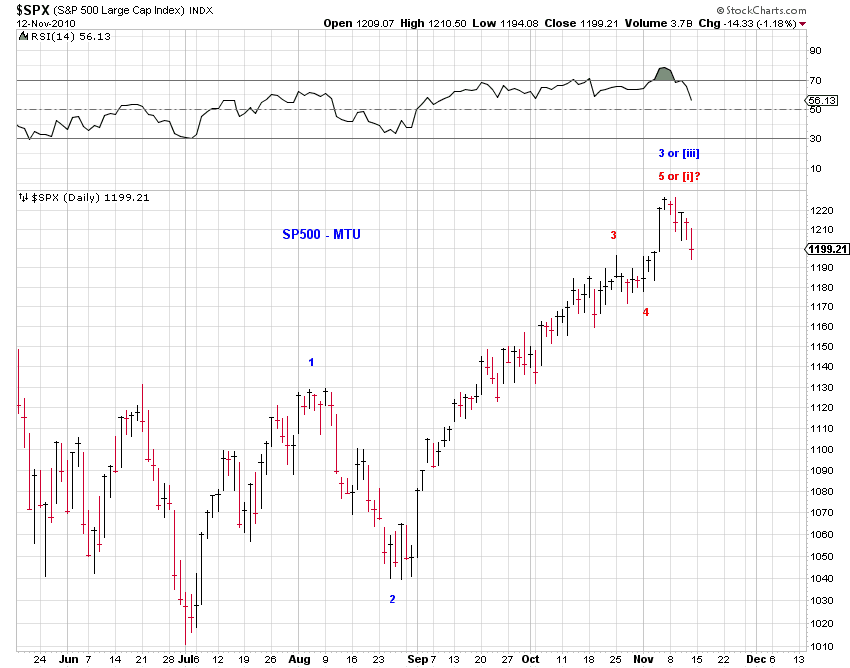
 At the moment, odds moderately favor a corrective fourth wave decline as either [iv] of minor wave 3 or minor wave 4 since the July low, with the initial major dynamic support at 1157 and resistance at 1216 in SPX. Here's what I mean - Chart 3 (SPX) and Chart 4 (COMPQ) offer the finer counts since the July low.

 Given the ambiguity whether the July-Aug advance is a leading diagonal wave 1 (blue) or a three (red) wave A, more bearish potential (than that of a fourth wave) exists. Interestingly, this week is a Fibonacci 89th week since the March 2009 low (Chart 5). A major high here can be quite appropriate.
The pullback from the recent peak appears more corrective than impulsive in futures. The wave structure may be counted as either corrective or impulsive in the cash indexes. Additional waves next week will help us make the distinction.
Chart 6 presents the Wilshire 5000 index as having traced out a zigzag or the initial part of a five-down. Chart 7 presents a squiggle count on the Dow mini - the correction does not appear to be over if the indicated triangle is truly a triangle; in other words, if not for the triangle, the correction could have potentially ended at Friday's low (note that ES had made a lower low).


[Near Term Gold]
The decline from the recent peak in Gold is a "clear" zigzag so far. It could morph into a larger five-down if the top is in (red), but odds favor the pullback as part of of fourth wave correction (blue) OR even the entire second wave decline (green) in an extended fifth wave (which would be immediately bullish). See Chart 8 and Chart 9.

