The logic, structure and targets of the new primary wave counts can be found in the weekly commentaries over the past month - Moment of Truth II (10/29/10); Unfinished Business (10/8/10, 10/15/10, 10/22/10); Potential Reversals in the USD and Bonds, will Stocks Follow (10/15/10); Dollar Bottoming and Risk Assets Topping(10/8/10).
Since major domestic stock indexes have made fresh recovery highs beyond their respective April highs, the proposed end to the hope rally, it's time to summarize the new primary wave counts and make them "official".
Stocks (long term)
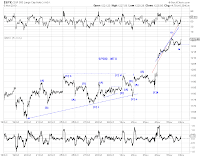
The primary count for SP500 (and other senior indexes) is that the hope rally remains a bear market (A)-(B)-(C)-type rebound and that the current advance is wave (C) of this rebound (Chart 1). From Moment of Truth II (10/29/10), "a likely target zone is 1352.67-1378.31 where (C)=0.618(A) and a 15.23% increase from the recent high based on the target for NDX. A second (less) likely target is 1222.16-1228.74 where (C)=0.382(A) and a 0.618 retrace of the 2007-2009 crash)." As of today, SP500 is practically at its 0.618 retrace.
The primary count for NDX and Nasdaq Composite is that the advance since the late 2002 low remains a bear market [W]-[X]-[Y]-type rebound and the the current advance is wave (C) of [Y] (Chart 2). From Moment of Truth II (10/29/10), "For the Nasdaq 100 Index (NDX), a likely target is around 2462.84, where [Y] = [W], or 15.23% upside potential from its recent retracement high of 2137.33."


While a number of credible alternative counts exist, particularly with respect to the senior indexes, all (with the exception of the super-bullish count) also anticipate a major reversal to take out at least the July low when the current advance ends. The difference is in the projected magnitude and trajectory of the additional upside potential.
Stocks (near term)
There are several near term tracking counts (Chart 3). The sharp rally this week appears to tilt odds towards the more/most bullish ones.
(green) Most bullish. The market is ONLY finishing wave iii of (iii) of [iii] of 3 of (C). This count does not use a triangle to describe the October consolidation. The absolute and relative momentum over the past few days seem to favor this interpretation, but is somewhat counterbalanced by the supposed (but brief) strength of a post-triangle thrust (see the blue count).
(blue) Moderately bullish. The market is finishing wave [iii] of 3 of (C). The post triangle thrust is wave (v) of [iii] in this context. Chart 4 offers a squiggle count.
(red) Least bullish. The market is finishing wave [v] of 3 of (C).


Chart 5 (red labels) shows the most bearish count which is relatively less probable. This is effectively a double top formation. Wave (C) is a double zigzag and is unusually short relative to wave (A). But wave (C) gets the hope rally to around the 0.618 retrace of the prior decline. If the proposed wedge in AUDJPY plays out and its correlation to SPX continues, it lends some support to this interpretation (Chart 6).


USD index (long term)
 From a wave perspective, there always have been ambiguity whether the Dec09-Jun10 advance and the Jun10-Nov10 decline in the DX are 3-wave or 5-wave structures. Objectively speaking, the Jun10-Nov10 decline is no less a five than the Dec09-Jun10 advance if one trusts that the current decline is a five. Conversely, the current decline is no less a three than the prior advance either if one trusts that the current decline is a three. So the consensus count on the DX may very well need to be tweaked (Chart 7). From this fresh perspective, the main counts are the blue (bullish) and the red (bearish), with the consensus count (green) now a more distant contender.
Subjectively, if one wishes to take a bearish view on USD in general and the DX in particular, one may find re-reading the long term analysis on the Euro in Range Busting Stocks and Bottoming Euro (6/4/10) still a pleasure some 5 months after it was written.
 Subjectively, if one wishes to take a bullish view on the DX, one takes consolation in the remarkable fact that the late 2009 low in the DX is still intact - in the sense that
[1] both QE-0 and QE-1 announcements started to devalue the dollar around the peak in the DX,
[2] QE-2-lite and QE-2 communication started around the mid range in the DX,
[3] but the actual QE-2 announcement took place when DX had fallen to the bottom of the range (Chart 8).
Finally, the blue count (bullish) above suggests that the late 2009 low may not/should not matter after all to dollar bulls.