Wednesday, June 30, 2010

Intraday Update (for 7/1/10)

[326PM] SPX/mini count update - potentially the first semi-decent looking five-up in the 1-min squiggle.

[Overnight Update 641AM 7/1/10] SPX/mini and Euro udpate, the overnight lows are likely important pivots.


[Overnight update 1055PM 6/30/10] SPX/mini squiggle count update -

Market Timing Update (6/30/10 Close)

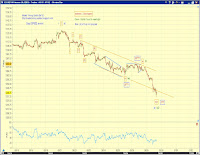
Downward price pressures persist, but bullish counts and rebounds are not out of the picture. Chart 1 updates the top counts. Chart 2 offers a squiggle count on the SPX Sept E-mini. The trend channels point to a potential target.


This is the 3rd divergence between EUR/USD and SPX. The first two occurrences resolved to the downside, is this time different?

Intraday Update (6/30/10)

[Overnight Update 730AM] SPX/mini and Euro -

Tuesday, June 29, 2010

Market Timing Update (6/29/10 Close)

The SP500 index made a fresh low for the year while the Dow and the Russell 2000 did not.
The EUR.USD has fallen but is still far from its June 6th low (Chart 1).


I'm keeping all top competing counts on the table for the moment. The near term low is one of the following counts (from most bearish to the least bearish) in Chart 2:
[Red] i-down of (iii) of 3 of (1)-down.
[Red] (i)-down of 3 of (1)-down.
[Grey] A-down of the second part of an ABC-(X)-ABC correction
[Green] [b]-down of 2-up of (1)-down, where 2-up is an expanded flat in SPX and potentially a regular flat in INDU and RUT.

Note that with the exception of the flat count (Green), the rest of the counts are all bearish, potential interim rebounds notwithstanding.

Chart 2 offers an impulse as well as a corrective count on the decline since the June 21st high in SP Sept E-mini.

Intraday Update (6/29/10)

[145PM]SPX/mini - squiggle update

[1223PM] SPX/mini count update, in 3 time frames

[1010AM] SPX/mini count update
Nearing a near term support per an A-B-C decline or 5-down or (i)-(ii)-i decline

[822AM] SPX/mini, And this chart counts the squiggles


[Overnight update 806AM] SPX/mini- We got our answer to the options I highlighted in yesterday's Update - Post triangle thrust down OR iii of (iii) thrust up ? We clearly got a post triangle thrust (most likely as a fifth wave).

This chart updates the top bearish and bullish counts that have been presented recently, with minor adjustments at smaller wave degrees. The corrective/bullish count is a bit forced at the moment.

Monday, June 28, 2010

Market Timing Update (6/28/10 Close)

Post triangle thrust down OR iii of (iii) thrust up ?
Chart 1 highlights these top options based on squiggle counts. Let's see which side of the trading range the market breaks out from.

Intraday Update (6/28/10)

[Pre-close 326PM]SPX/mini count update [338PM adds squiggle of squiggle (right chart)]
[942AM] SPX/mini count udpate -

Friday, June 25, 2010

MTU Weekend Ed. - Wave (i)-up or (i)-down (6/25/10 Close)

The big picture
Chart 1 updates the current top big-picture scenarios. These top scenarios are the same as those highlighted last week in Squiggles Point the Way (6/18/10). The reversal over the past week most likely has started minor 3-down of intermediate wave (1)-down (red labeled count).

By definition, the reversal (sell-off) over the past week has confirmed the end of the rebound since the Jun 8th low. Thus according to all but one of these counts, the near term trend (in terms of a time frame of at least multiple weeks) has now turned down.

The green labeled count which places the end of minor wave 1-down at the June 8th low still calls for a rebound above last week’s high (1131.23 in SPX). The further the decline, the less likely this count becomes.

On the bullish side, there’s a small chance that the June 8th low marks the end of pullback since the April high and the market is aiming at new highs, if one reads 7 waves within April-May pullback. But there is so much for the bulls to recover under this interpretation before its status can be rationally elevated at all. Since the weekly commentary tends to focus on the bigger picture, it is fair to mention it here.

Short term (in terms of multiple days) outlook
(i)-down or (i)-up?
Squiggles may point the way again this time. Friday’s low is likely either (i)-down of 3-down of (1)-down (which is very bearish), OR Friday's high is likely (i)-up of [c]-up of 2-up of (1)-down (which is bullish in the short term). See Chart 2 for a squiggle count.


The U.S. Dollar
There has been a lot of focus on the count of the U.S. Dollar index (DXY) lately. I present my preferred counts in Chart 3 and Chart 4.

In terms of the big picture, the current advance (most likely as (1)-up of [3]-up) from the late 2009 low in the USD index will likely exceed 90 or even 95 when complete.

At the moment, the USD index is either in wave 4 (blue labeled count) OR only [iv] of wave 3 (green labeled count) of this advance.


Appendix

n

Intraday Update (6/25/10)

[340PM] Pre-close squiggles and squiggles of squiggles (Sept emini)

[130PM] SPX/mini count update - one more try at nailing the "bottom": bullish counts say the bottom is in, the P3-type bearish count says this rebound could be an expanded flat iv of (i)-down.

Thursday, June 24, 2010

Market Timing Update (6/24/10 Close)

[4PM stocks] The current leg of decline is likely approaching its end. The squiggles shows the top scenarios. Given the deep retracement and the wave structure, one has to give serious consideration of one of the following two scenarios playing out
[1] Wave 3-down in a P3-type of sell-off has started at the June high.
[2] The market is going to new highs and the current pullback is a second wave retracement

Intraday Update (6/24/10)

[Pre-close 3PM] SPX/mini - adding details to the bearish count given the deep retrace and squiggles. The risk is that v of (i) of 3 down can extend...


[1030AM]SPX/mini count update - ED

[1013AM] SPX/mini count update - ED?

[Overnight Euro 816AM] Nice looking squiggles


[Sept SPXmini squiggle] If the low is in ... Note that the SPX cash index is also testing a trendline and its 20-day MA.


[Overnight Stocks 752AM] Calling at least a near term lows around here. The best count on the Sept SPX-mini is a 7 wave decline so far.

Wednesday, June 23, 2010

Market Timing Update (6/23/10 Close)

[4PM Stocks and Euro]
Resolution tomorrow ? As you can see in Chart 1 of the Sept SP mini, there are two ways to count the decline ([i] of 3-down in the more bearish case) as being complete at today's low (light blue labels and the bordered labels) while there are two ways to count the decline as being missing a final drop to lower lows (green labels and blue labels).

So far, the rebound since this morning's low is more corrective than impulsive (chart 2, SPX cash), unless we assume a LD advance.

Price actions overnight and tomorrow should bring about resolution of this uncertainty.


Positive divergence between US stocks and Euro/USD. One piece of observation which may lend some support to the possibility that a near term low in stocks may be in place is the positive divergence between stocks and EUR.USD (Chart 3). The caveat is as discussed above - no confirmation yet and a likely corrective rebound so far off the lows.

EUR.USD has broken above the overnight high as well as yesterday's high after the FOMC announcement (potentially reflecting better carry as well as the Fed's downgrade of the U.S. economy) while major U.S. stock indices have so far unable to successfully challenge the corresponding highs (Chart 1).

Intraday Update (6/23/10)

[313PM]SPX/mini pre-close update


[245PM] If the euro is any indication ...

[1042AM] SPX/mini -


[Overnight Euro 805AM]
As in stocks, no clear impulse up here, so far.
[Overnight Stocks 755AM] No new lows overnight, but no clear impulse up so far either. Added a bullish count (green) to the fold.