 The SP500 index made a fresh low for the year while the Dow and the Russell 2000 did not.
The EUR.USD has fallen but is still far from its June 6th low (Chart 1).
 I'm keeping all top competing counts on the table for the moment. The near term low is one of the following counts (from most bearish to the least bearish) in Chart 2:
[Red] i-down of (iii) of 3 of (1)-down.
[Red] (i)-down of 3 of (1)-down.
[Grey] A-down of the second part of an ABC-(X)-ABC correction
[Green] [b]-down of 2-up of (1)-down, where 2-up is an expanded flat in SPX and potentially a regular flat in INDU and RUT.
Note that with the exception of the flat count (Green), the rest of the counts are all bearish, potential interim rebounds notwithstanding.
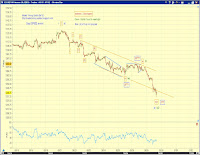
 Chart 2 offers an impulse as well as a corrective count on the decline since the June 21st high in SP Sept E-mini.
No comments:
Post a Comment