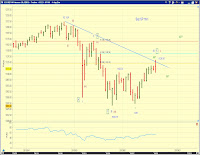
This count is also in sync with the Euro count below.
I place it at the top of the list of competing counts.


[4PM Stocks and Euro] Today's high is likely [a] of 2-up (if 1 ended on June 8th) or the end of 2-up (if 1 ended on May 25th) according to counts on the squiggles (see Chart 1 on the cash index and Chart 2 on the Sept E-mini. )


 The decline from the overnight high in the Sept E-mini may be a flat (bullish) or a completed 5-wave down if one assumes a small degree LD (bearish). See Chart 3. Thus today's low could be (a) of [b] of 2 (or [b] of 2) OR (i) of 3-down.
In terms of time, the Apr26-Jun8 sell-off lasted 30 sessions, today is the 10th session since the June 8th low on a 50%+ retracement. So a [c] wave advance following a [b] wave correction is not a ridiculous scenario if 1-down ended at the June 8th low.
If the market is tracing out a flat since the May 25th low, the top should be in.
I've kept the bullish count on the table based on a related analysis of Euro. Today's selloff in the EUR.USD can be a fourth wave (Chart 4) and the decline itself is a zigzag so far (Chart 5).


 To summarize, we have a corrective decline in the Euro (so far) and a potentially impulsive selloff which may be a flat in stocks. Price actions over the next two days should clarify things. And finally, the top competing counts are shown in Chart 6.
No comments:
Post a Comment