*** Stocks ***
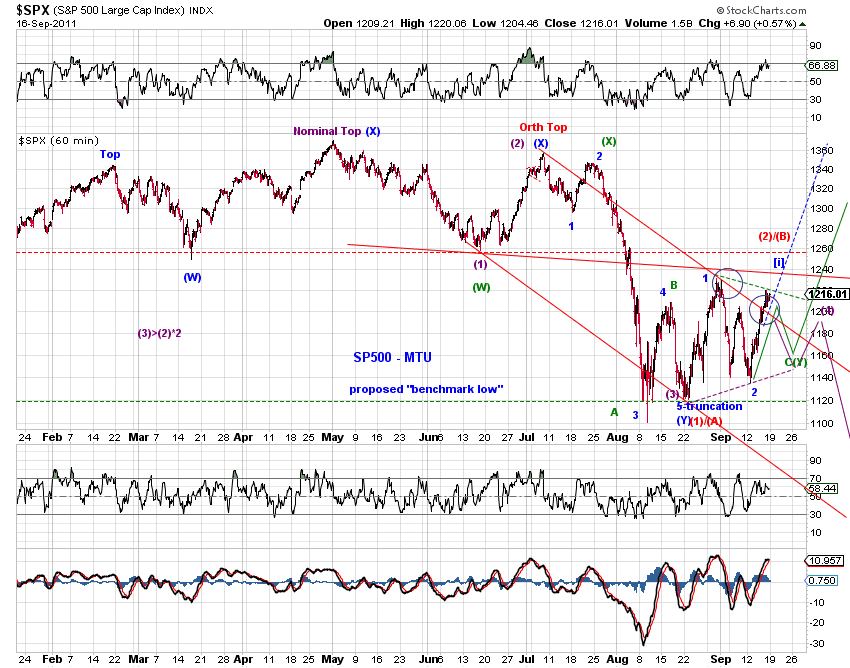
 The proposed benchmark low in SPX held and stocks rebounded smartly in a number of key global markets.
(1) SPX was up 5.35% for the week and closed once again above the cluster of prior support/resistance levels (Chart 1).
(2) The intraday update on Monday (9/12/11) observed that “time-cycle, wave structure and global relative strength / relative value suggest that a meaningful low in stocks might be approaching.” Subsequently, the German DAX surged 13.90% from it’s nominal low on 9/12/11 (Chart 2).


The bottoming/rebounding process has been notably asynchronous. European stocks registered a meaningful low only this past week while the lows in U.S. stocks occurred in early August. Even for U.S. stocks, the Nasdaq 100 index has already recovered 60%+ of the decline (Chart 3) with the Nasdaq Composite index not too far behind, while the rest of the market is still attempting to make a higher high beyond a 50% retrace.
At the margin, such asynchronicity /divergence appears to be more bullish than bearish, interim pullbacks notwithstanding, in the sense that
(a) The rebound in European stocks, the center of the recent storm, has just begun. This hints at eventual upside potential for U.S. stocks.
(b) Within a bearish interpretation of the recent sell-off, the already deep upward retrace in NDX and the additional upside potential for SPX hinted by the DAX may signal that current rebound is a wave (B)-up rather than a much more bearish wave (2)-up.
But the jury is still out.
As discussed in recent weekly commentaries, the bottom line implications are as follows.
(1) As long as the proposed benchmark low holds, SPX has a shot at making a new recovery high. In other words, the deep correction is over (Chart 4, blue and green) and the hope rally continues.
(2) A break of the proposed benchmark low (warning) and the Aug 8th low (nominal low, confirmation) would suggest that the sell-off from the nominal high is the initial leg of the decline (Chart 4, red, purple).
Chart 5 offers a squiggle count of the current advance in SPX, suggesting a near term pullback is likely in sight.

*** Bonds ***
Long-term Treasuries have satisfied the minimum requirement for a top (low in yields) (Chart 6 and Chart 7 green), but there's much ambiguity as to where the low in long-term yields lie. Long term rates are likely remain policy driven for the time being.
A weaker dollar offers a means to accommodate the policy driven low yields, until markets get too rigid to bear due to policy and/or position constraints.
For the time being, the reality is that
(a) the U.S. Treasury continues to enjoy low interest rate loans (at the long end) and interest free loans (at the very short end).
(b) "stressed" financial institutions in the euro zone can now enjoy "unlimited" low/free interest dollar funding thanks to a group of central banks and willing Treasury buyers.
What goes around comes around.


*** Gold ***
 Regardless of the larger count, the decline from the recent high continue to look more corrective than impulsive. The proposed triangle / double-three / flat structure is still tracking (Chart 8).
*** USD ***
The USD index saw a near term top and the euro saw a near term bottom at the beginning of the past week (Chart 9 and Chart 10). Whether the respective top and bottom hold is important in calling a potential trend change dating back to the Q2 pivot. A break out above the recent high in USD index would significantly raise the odds that it has bottomed in early April.

