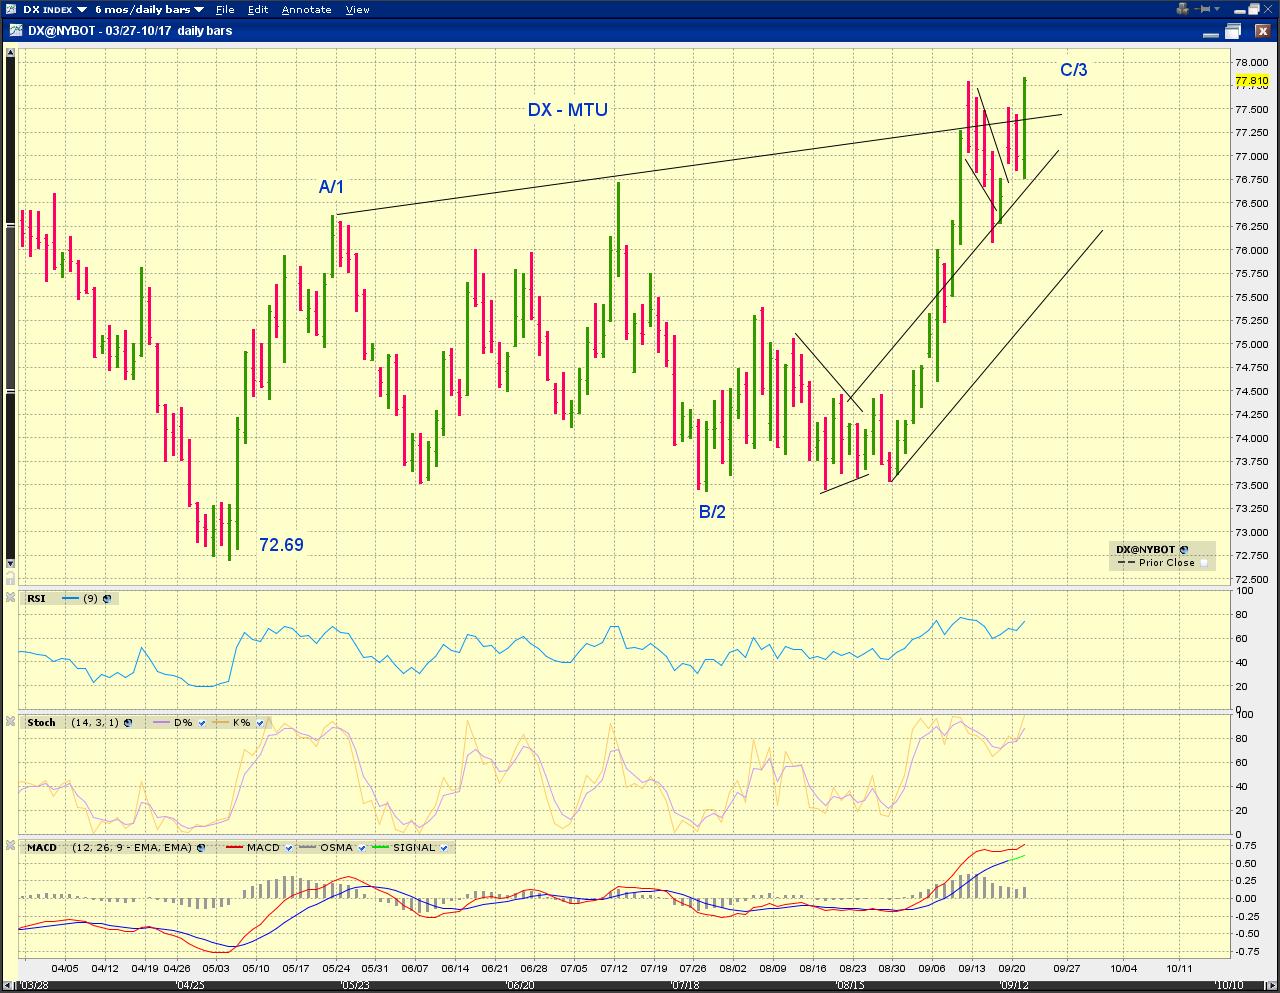
 DX is on its way to conclude 3-up or C-up.
[EOD] Stocks -
Chart 1 updates the tracking counts, all are still tracking. Chart 2 shows a close up on 30-min bars.

 Subjective view - Odds appear to favor additional (probably meaningful) upside potential.
(1) The sell-off into the close fits well with the anticipated wave [ii] (blue, red) or a wave E (green, note the FOMC event). All three counts imply substantial near term upside once this pullback is over.
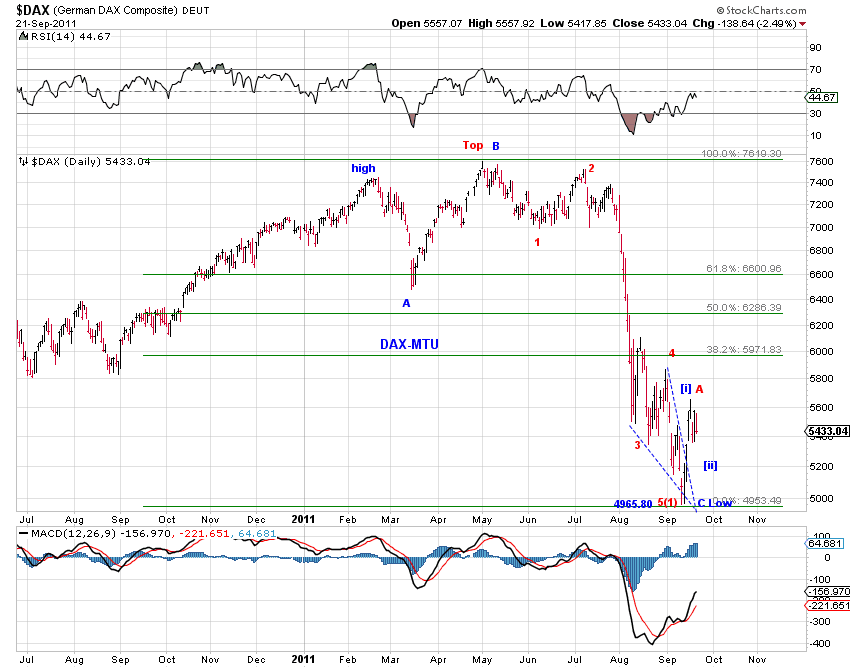
(2) This decline fits well with the anticipated pullback in the DAX ([1150am entry]) .
(3) A wave (4) or B (preferred) triangle (purple) calls for a small-degree wave E-up before the next bearish move.
Risk to the subjective view -
(1) R2K did take out its mid-Sep low by a hair, but that low is likely a truncated one.
(2) If the market plunges from here, the interim correction apparently took the form of a double-three - started at the mid-Aug orthodox low and ended yesterday with a truncated wave C.
[130pm, 230pm] SPX (pre-FOMC)(post-FOMC)-


[1150am] DAX update -
pullback still in progress, see 2nd chart below
[710am] ES update -