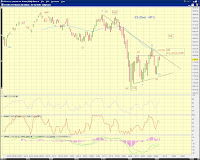
The decline from today's high appears corrective so far.
It is possible to count a five-down in SPX (with a triangle 4th wave). It could be (C)-down of [4]-down as marked in Chart 1. The decline can also be counted as a triple zizgag, which is more obvious in NDX (Chart 2).


 In terms of the larger count, the advance Tuesday's low to is
(bearish) wave C-up of wave (4)-up from the nominal high in May (Chart 3, purple)
(bullish) initial wave up of a additional advance
[135pm, 240pm] SPX squiggles - BB

 [1020am] SPX and ES update -
tracking the green count in SPX for now (but the blue and red counts are still tracking well) and an update to the 835am ES update entry

 [845am] Bond update -
fifth wave-up of the post triangle thrust or topped/2nd-wave retrace in progress

 [835am] ES update -
The overnight high makes it a decent-looking five up from the recent low in ES (chart 1). So the current rebound is (chart 2)
(bullish-blue) (i)-up of [iii]-up
(bearish-red) (c)-up of [iv]-up OR (i)-up of [c]-up of 2/B-up; note that in this case going above 1200.50 in Dec ES will results in no technical truncation.

 [7am] Gold update -
7 waves down from the nominal high, corrective, raising the odds of a triangle or end of correction. To a lesser extent, a possible 1212 structure, either bullish or bearish.
