The decline off the current high in SPX counts well as a regular flat with C =1.68 A which fits one of the guidelines (C =0.618 A beyond A)(Chart 1, blue). It could be the initial stage of an impulse (Chart 1, red) or part of a larger 4th wave correction.
Chart 2 shows how the current decline fits into the possibility of a 2nd wave retrace (Chart 2, green) or a trend change (Chart 2, blue).
If this is a 2nd wave retrace, Chart 3 shows two possibilities: (1) wave [v]-up or 3-up extends (Chart 3, gray) or (2) an extended wave v-up of (v)[iii]-up within a greater extension (Chart 3, green).
Finally, a five-up off the March low in NDX looks quite mature (Chart 4). It's possible to count the NDX action as an expanded flat correction (especially in NQ futures) or a downward reversal . On a separate note, NDX/NQ is currently approaching fib and trendline support (Chart 5 and Chart 6). Let's see what tomorrow brings.


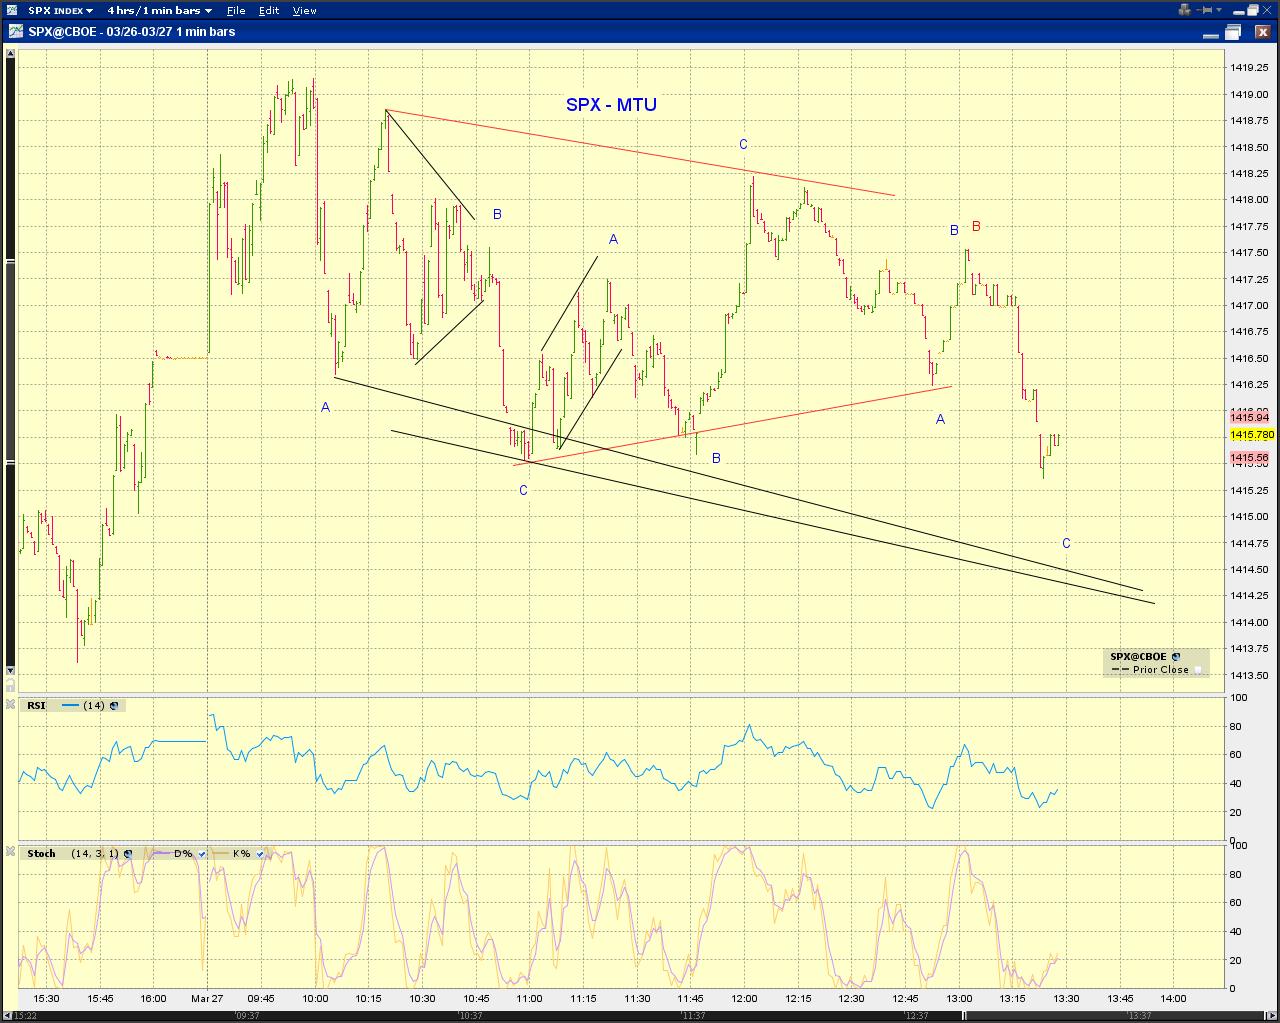
[130pm] SPX squiggles -
Follow up squiggles on a lower low. In addition, a flat is another reasonable option. See 2nd chart below.
[1240pm] SPX squiggles -

[9am] ES update -

