There's no change in the primary big-picture count (Chart 1).
For the very near term, we have choices (see Chart 2)
(bearish - blue) Today's advance is a deep retrace of a prior LD declin, applicable to both INDU and SPX
(moderately bullish - red) wave (v) of [v] is in progress, may have truncated though, see 155pm entry for details.
(very bullish - green) wave [b] consolidation is still in progress, wave [c]-up to come.


[155pm] SPX squiggles -
see the 2nd chart below. Choices for the one-degree higher count are
(1) a fifth wave about to truncate or extend - black,
(2) a d-e-e-p 2nd wave retrace of an LD decline (red, and red in the 1105am update)
[1105am] SPX update -
tug of war between bull (green, red alt) and bear counts (blue, red).


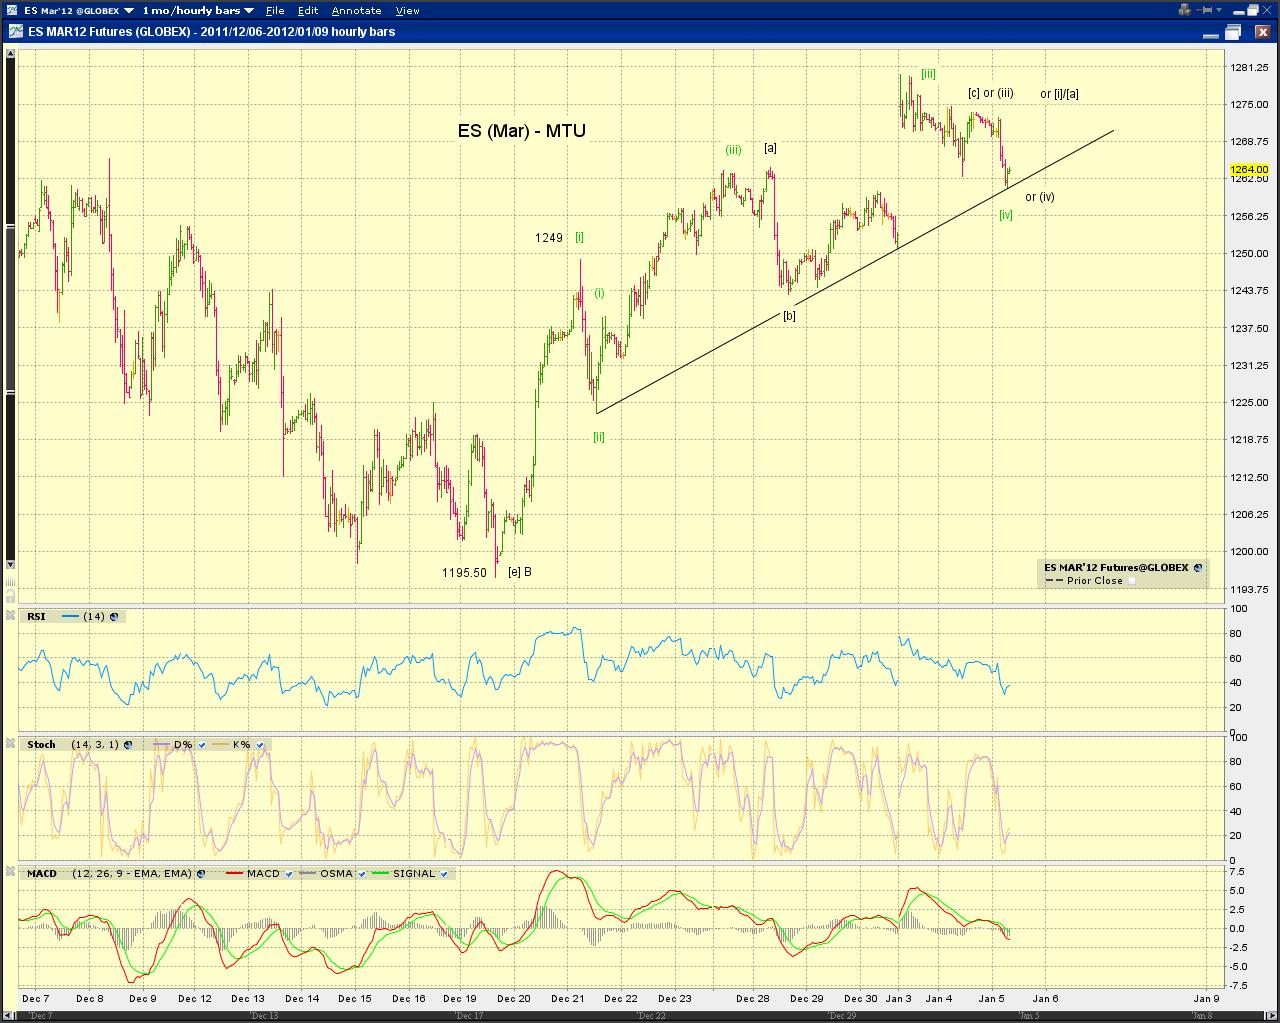
[710am] DAX, ES update -
From a wave structure perspective, DAX looks relatively more bullish at the moment than ES. DAX is approaching the 0.382 fib retrace. See yesterday's chart for the larger count.