There have been a lot of "3"s and no new high so far. The dynamic fits that of a B wave or an ED.
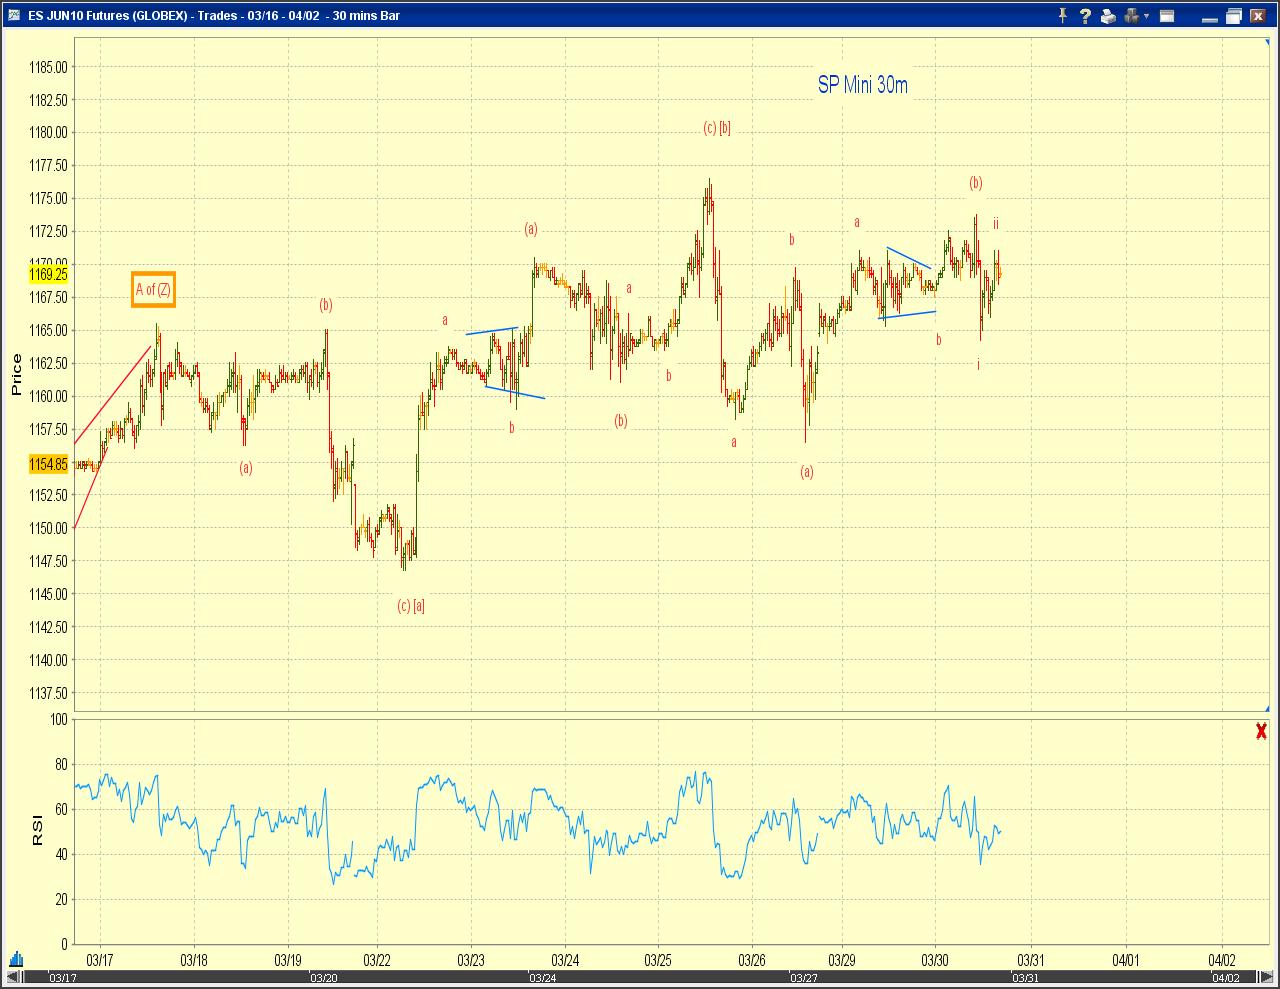
Chart 1 offers an update on the near term bearish B-wave count.
Chart 2 offers an update on the near term bullish count, with [v] of A? as a potential ED.


No comments:
Post a Comment