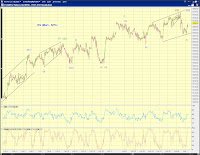
 With the after-hour action, ES offers interesting perspective.
 (blue) topped/topping with (v)=(i)
(red) EDT, probably one more down-up subdivision, and capped by 1384
(green) bullish.
[EOD] Stocks -
Larger tracking counts are unchanged (Chart 1). There are several ways to count the near term action (Chart 2).
(purple - likely) Three-down and three-up. A potential flat decline. Fits the green [iv]-down in Chart 1. c-down of (a)-down of [iv]-down to follow.
(green - likely) Another leg of the upward sub-division towards the completion of green [iii], purple [v] in Chart 1.
(red - less likely) A truncated top at today's high. The small degree wave [4] is odd shaped and disproportionally large. But it's one of the top possibilities.


[1228pm] SPX squiggles -
bearish expanded flat follow up, see the 2nd chart below.
[1035am] SPX squiggles -
potential for a bearish expanded flat in the cash index, given the ambiguity in the prior decline.


[7am] ES update -
ES regained near term support at the black trend line (Chart 1), is poised to kiss the red trend line. There's potential for the rebound to be part of an expending EDT (blue, Chart 2) or something more bullish (green, Chart 2). The decline from yesterday's high is best counted as a three. The burden is on the bearish potential (1/2/1/2) to prove itself. It'll be interesting to see how the cash market opens.

