Bullish - a flat or expanded flat correction in the cash index (blue) AND a zigzag decline from the nominal high in ES
Bearish - a truncated top in SPX and ES (not in INDU) is in place. today's decline is the initial leg down.
see charts.

 [1208pm] SPX update -
potential bearish count from the high - not saying that it is one.

[1130am] ES update -
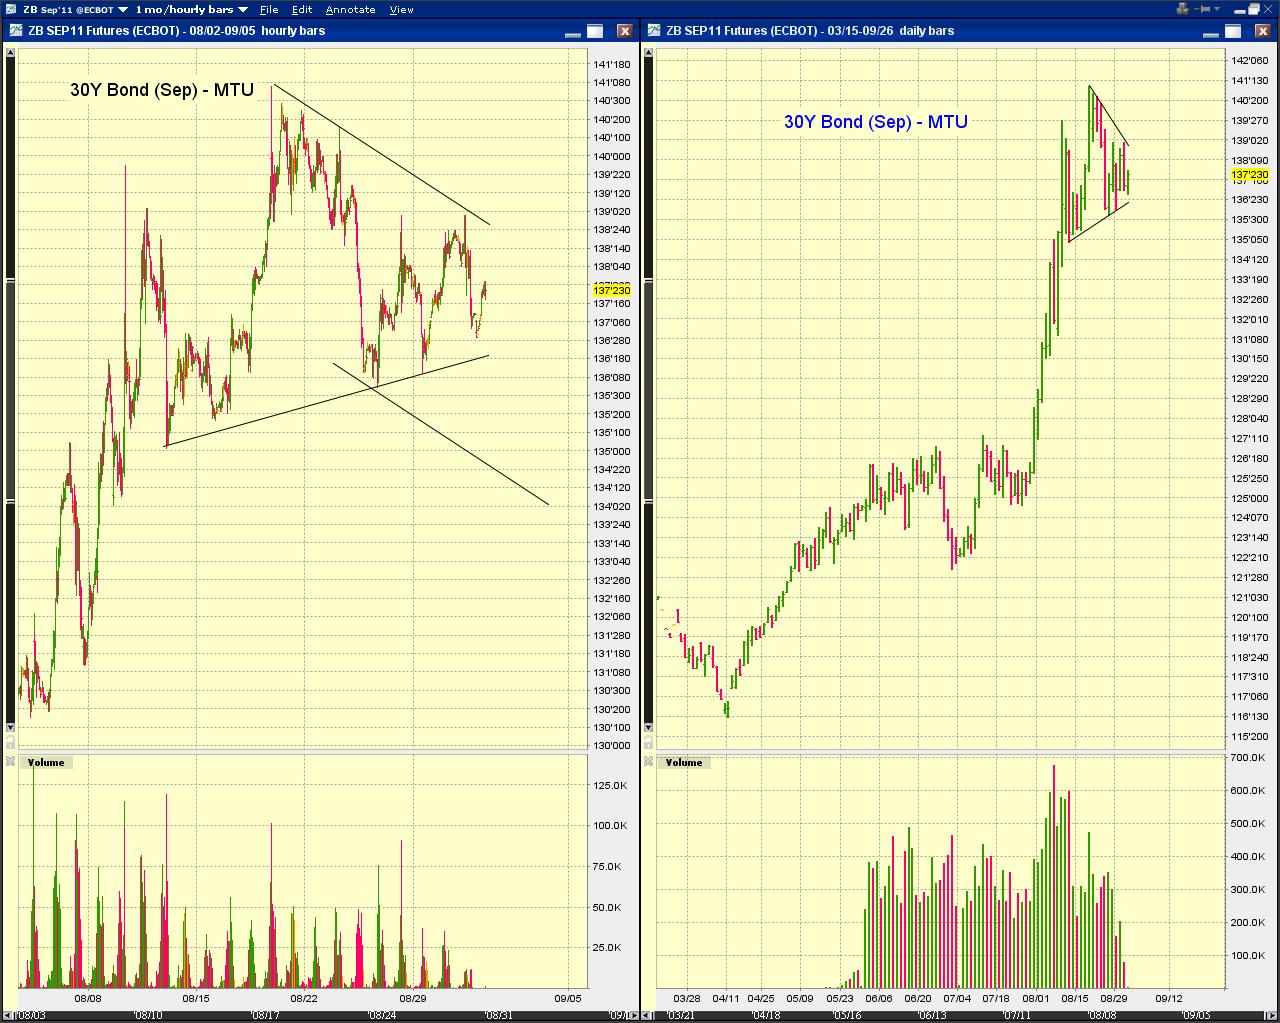
See the 2nd chart below. Potential triangle.
[1110am] INDU update -
running flat, ascending triangle or very short fifth.

 [8am] ES and Bond update -
This ES chart outlines the top near term options.
bullish-black- a potential expanded EDT or even a regular five-up as c of (c), say. This corresponds to a possible zigzag decline in bonds.
bearish-red- A near term top is in place ending with a truncated small-degree fifth overnight. This corresponds to a potential triangle consolidation in bonds as outlined on the 2nd chart.