[2] The wave that is currently in progress is EITHER
B-down of (Z) - chart 1 and 2, red labels
OR [iv] and/or [v] of A (or even C) of (Z) - chart 1 and 2, blue labels

 [3] The 3 to 4 declines today (including the instance overnight) are much more impulsive than episodes of inter-selloff rebounds. In addition, these intraday declines are accompanied by higher volume (Chart 3). It gives a hint of a 5-3-5-3-5 structure.
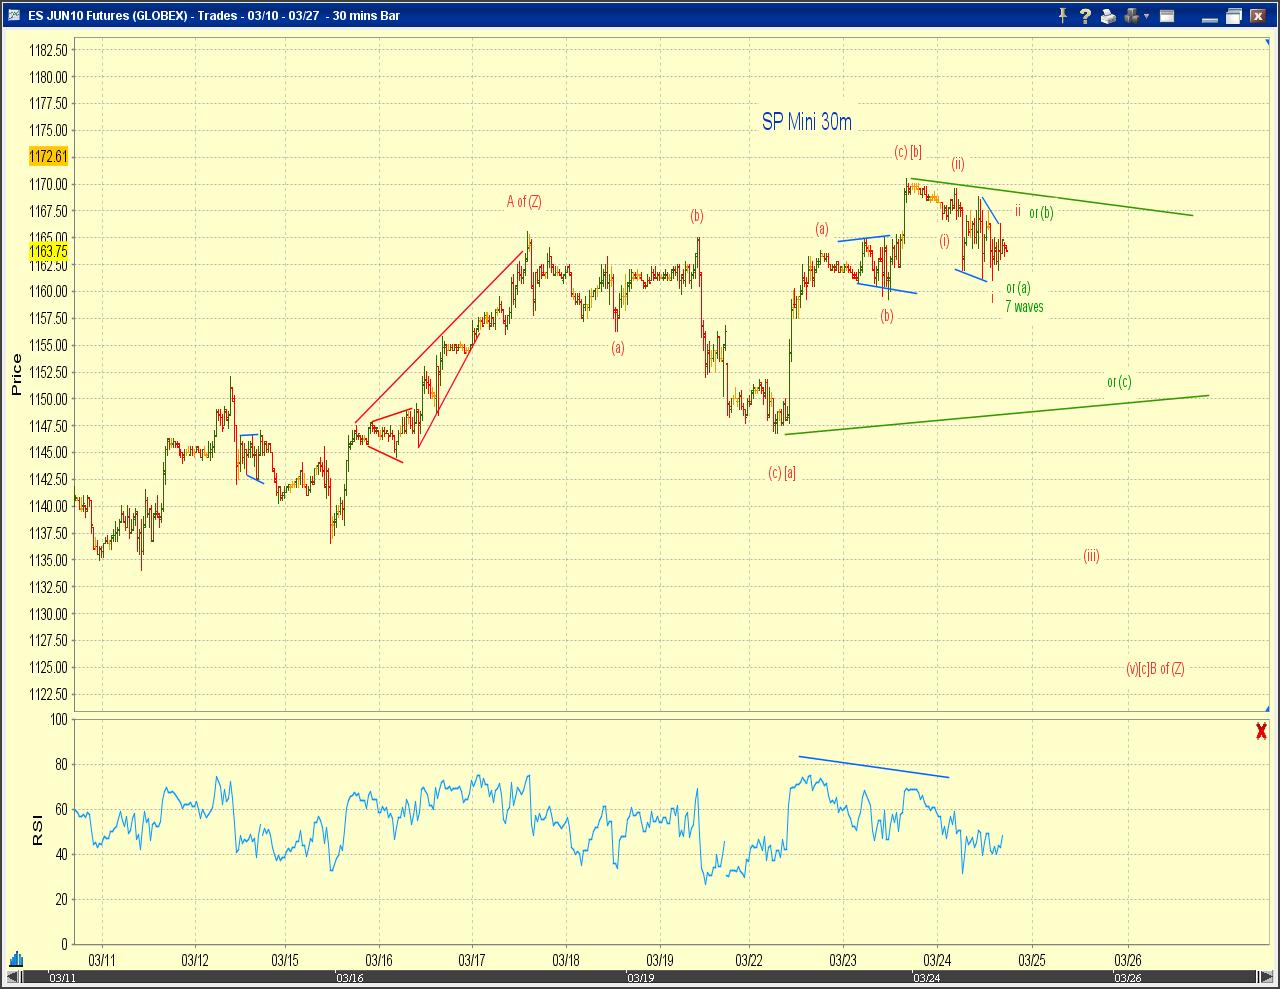
[4] Chart 4 focuses on the potential wave counts of B-down of (Z) as corrections are usually much more complex. The top candidates for B-down are an expanded flat (red) or a triangle (green).
Within the context of an expanded flat, chart 4 has highlighted the most bearish squiggle structure, reflecting the potential 5-3-5-3-5 structure discussed in item [3] above.
That is, I've penciled in a LD i-down of (iii)-down of [C] of B. If so, iii of (iii) of [C] of B is directly ahead.

No comments:
Post a Comment