Wednesday, November 17, 2010
Tuesday, November 16, 2010
Market Timing Update (11/16/10)
[4pm] stocks
Bearish -
Today's sharp decline makes it easier to construct an motive wave count - see the red count in the cash and futures charts below. The most likely candidate for the motive wave is wave C-down of and expanded flat since the April high, and to a lesser degree either a P[3]-down scenario or a part of a complex multi-year (x) wave discussed in Let's Recount II (long term) (11/12/10) as "[IV]-small-flat".
Bullish -
It is still relatively complicated to discern the structure of a corrective wave count. However, we may just have enough waves to make a decent attempt. The structure is likely a zigzag-x-flat in futures - see the black count. The form looks better with an additional lower low tomorrow, perhaps to get the market close to the 0.382 retrace. But a lower low may or may not be required. The most likely candidate for the corrective wave is minor wave 4 since the late August low.


Bearish -
Today's sharp decline makes it easier to construct an motive wave count - see the red count in the cash and futures charts below. The most likely candidate for the motive wave is wave C-down of and expanded flat since the April high, and to a lesser degree either a P[3]-down scenario or a part of a complex multi-year (x) wave discussed in Let's Recount II (long term) (11/12/10) as "[IV]-small-flat".
Bullish -
It is still relatively complicated to discern the structure of a corrective wave count. However, we may just have enough waves to make a decent attempt. The structure is likely a zigzag-x-flat in futures - see the black count. The form looks better with an additional lower low tomorrow, perhaps to get the market close to the 0.382 retrace. But a lower low may or may not be required. The most likely candidate for the corrective wave is minor wave 4 since the late August low.


Monday, November 15, 2010
Market Timing Update (11/15/10 Close)
[905pm] Futures update (ES) -
A nice five down from the 12PM high.

 [720pm]Squiggles on $TRAN -
Here's a look at the squiggles on $TRAN. If one takes the nominal high as the top, there's a decent fiver down. If the rebound since the low is a five (a passable one as indicated on the chart), wave C-up of the rebound should show up tomorrow. Otherwise, if the rebound since the low is a three, down it goes.
[720pm]Stocks - futures squiggles from today's high -

 [630pm] Stocks - futures structures from the top
Not sure about the accuracy of this count, but this double zigzag from the top aligns ES, YM and NQ.

 [4pm] Stocks - cash index structures


A nice five down from the 12PM high.

 [720pm]Squiggles on $TRAN -
 Here's a look at the squiggles on $TRAN. If one takes the nominal high as the top, there's a decent fiver down. If the rebound since the low is a five (a passable one as indicated on the chart), wave C-up of the rebound should show up tomorrow. Otherwise, if the rebound since the low is a three, down it goes.
[720pm]Stocks - futures squiggles from today's high -

 [630pm] Stocks - futures structures from the top
Not sure about the accuracy of this count, but this double zigzag from the top aligns ES, YM and NQ.

 [4pm] Stocks - cash index structures

Saturday, November 13, 2010
Market Timing Update (11/12/10 Close)
This update focuses on shorter shelf-life items. Stock market wave structure since the July low and Gold movements since 2010 low.
Please see Let's Recount (11/5/10) for a discussion about the wave structure since the March 2009 low, and Let's Recount II (11/12/10) for a discussion about the wave structure since the Y2K peak.
[Near Term Stocks]
 What do you think of this count on the FTSE and the DAX mapped into SPX (Chart 1a 1b and Chart 2)? If so, leave room for an extended fifth wave in addition to bearish counts.

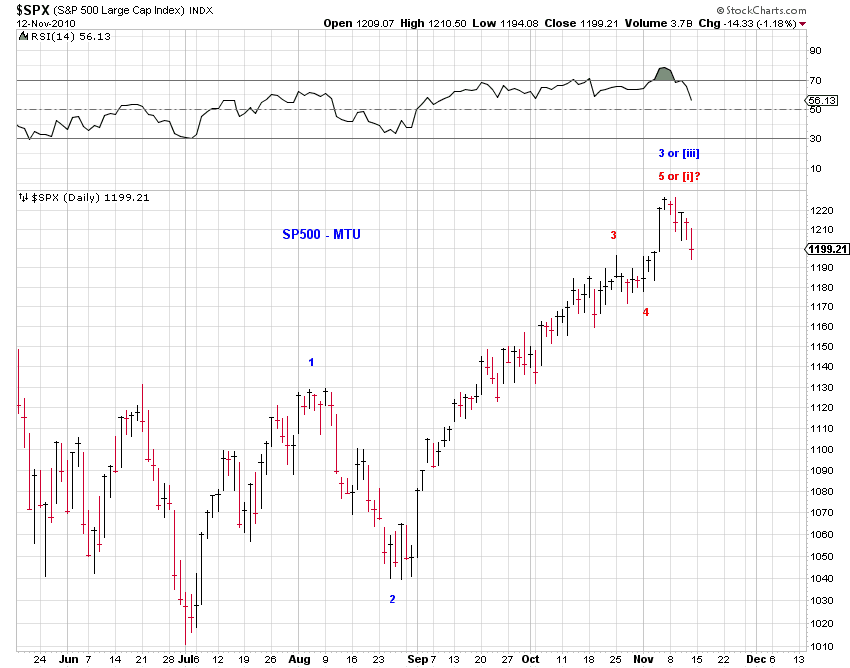
 At the moment, odds moderately favor a corrective fourth wave decline as either [iv] of minor wave 3 or minor wave 4 since the July low, with the initial major dynamic support at 1157 and resistance at 1216 in SPX. Here's what I mean - Chart 3 (SPX) and Chart 4 (COMPQ) offer the finer counts since the July low.


 Given the ambiguity whether the July-Aug advance is a leading diagonal wave 1 (blue) or a three (red) wave A, more bearish potential (than that of a fourth wave) exists. Interestingly, this week is a Fibonacci 89th week since the March 2009 low (Chart 5). A major high here can be quite appropriate.
The pullback from the recent peak appears more corrective than impulsive in futures. The wave structure may be counted as either corrective or impulsive in the cash indexes. Additional waves next week will help us make the distinction.
Chart 6 presents the Wilshire 5000 index as having traced out a zigzag or the initial part of a five-down. Chart 7 presents a squiggle count on the Dow mini - the correction does not appear to be over if the indicated triangle is truly a triangle; in other words, if not for the triangle, the correction could have potentially ended at Friday's low (note that ES had made a lower low).


[Near Term Gold]
The decline from the recent peak in Gold is a "clear" zigzag so far. It could morph into a larger five-down if the top is in (red), but odds favor the pullback as part of of fourth wave correction (blue) OR even the entire second wave decline (green) in an extended fifth wave (which would be immediately bullish). See Chart 8 and Chart 9.


Please see Let's Recount (11/5/10) for a discussion about the wave structure since the March 2009 low, and Let's Recount II (11/12/10) for a discussion about the wave structure since the Y2K peak.
[Near Term Stocks]
 What do you think of this count on the FTSE and the DAX mapped into SPX (Chart 1a 1b and Chart 2)? If so, leave room for an extended fifth wave in addition to bearish counts.
 At the moment, odds moderately favor a corrective fourth wave decline as either [iv] of minor wave 3 or minor wave 4 since the July low, with the initial major dynamic support at 1157 and resistance at 1216 in SPX. Here's what I mean - Chart 3 (SPX) and Chart 4 (COMPQ) offer the finer counts since the July low.

 Given the ambiguity whether the July-Aug advance is a leading diagonal wave 1 (blue) or a three (red) wave A, more bearish potential (than that of a fourth wave) exists. Interestingly, this week is a Fibonacci 89th week since the March 2009 low (Chart 5). A major high here can be quite appropriate.
The pullback from the recent peak appears more corrective than impulsive in futures. The wave structure may be counted as either corrective or impulsive in the cash indexes. Additional waves next week will help us make the distinction.
Chart 6 presents the Wilshire 5000 index as having traced out a zigzag or the initial part of a five-down. Chart 7 presents a squiggle count on the Dow mini - the correction does not appear to be over if the indicated triangle is truly a triangle; in other words, if not for the triangle, the correction could have potentially ended at Friday's low (note that ES had made a lower low).


[Near Term Gold]
The decline from the recent peak in Gold is a "clear" zigzag so far. It could morph into a larger five-down if the top is in (red), but odds favor the pullback as part of of fourth wave correction (blue) OR even the entire second wave decline (green) in an extended fifth wave (which would be immediately bullish). See Chart 8 and Chart 9.


Friday, November 12, 2010
MTU Weekend Ed. - Let's Recount II (long term) (11/12/10 Close)
In Let's Recount (11/5/10), we summarized a recount of the stock market wave structure since the March 2009 low, i.e. the hope rally. Aspects of the recount have been discussed in detail throughout October, a period when the market had been threatening to take out the April high.
That particular recount assumes the hope rally is primary wave [2] of cycle wave c of supercycle wave (a), i.e. the EWI count. Its implication is that the market will see fresh lows before any successful attempt at an all time high.
This particular long term count, which will be identified as "[IV]-large flat" (Chart 1 and Chart 2), is the most sensible one before the April high failed to hold. Unlike SP500 and other senior indexes, Nasdaq failed to make a higher high in 2007 nor a lower low in 2009. It makes sense that wave c decline of the potential flat since the Y2K peak has a few more legs.


 Once the April high fails to hold and the Nasdaq 100 index has already retraced 96.8% of the decline since the 2007 peak(Chart 3), the perceived likelihood of long term counts since the Y2K peak should have changed. It's high time we highlight the top competing long term counts. The only assumption among these scenarios is that all indexes are in sync in terms of their wave labels at "major" highs and lows. Let's begin.
"[IV]-large flat" - fresh lows before new all time high
Please see discussions and charts above regarding this count. Potential targets for the end of the hope rally are 1352.67-1378.31 and 1222.16-1228.74 in SPX. Please see Let's Recount (11/5/10) for details.
"[IV]-small flat" - most likely fresh lows before new all time high
This count sees the wave structure between the Y2K high and the 2009 low as a complete flat (Chart 4 and Chart 5). There are two variations within this count. The first variation is a zigzag supercycle wave (x) with the connecting cycle wave b likely to be protracted in time. The second variation is a multi-year complex supercycle wave (x) and the April high only concludes the initial primary wave [A].
The predominant implication is that the market will see fresh lows before any successful attempt at an all time high. Notably, in all likelihood, Nasdaq indexes will exceed their 2007 high before any attempt at fresh lows. Other than that, EWP does not offer an a priori structure for this corrective wave (x).


"[III]-unfinished" - new all time highs
This count sees the final stretch of the grand supercycle [III] is still ahead of us. The hope rally is the start of primary wave [5] of cycle wave V of supercycle wave (V).
Its implication is a multi-year bull market to new all time highs (Chart 6 and Chart 7). Please also see The Big Picture (U.S. Stocks) (2/21/10) for long term charts and discussions.


"[IV]-large triangle" - new all time highs before fresh lows
This count sees a multi-year sideways expanding triangle in the senior indexes (Chart 8). To be in sync with the senior indexes, the Nasdaq indexes likely will trace out a zigzag (Chart 9). Its implication is new all time highs fresh lows in at least the senior indexes.


That particular recount assumes the hope rally is primary wave [2] of cycle wave c of supercycle wave (a), i.e. the EWI count. Its implication is that the market will see fresh lows before any successful attempt at an all time high.
This particular long term count, which will be identified as "[IV]-large flat" (Chart 1 and Chart 2), is the most sensible one before the April high failed to hold. Unlike SP500 and other senior indexes, Nasdaq failed to make a higher high in 2007 nor a lower low in 2009. It makes sense that wave c decline of the potential flat since the Y2K peak has a few more legs.


 Once the April high fails to hold and the Nasdaq 100 index has already retraced 96.8% of the decline since the 2007 peak(Chart 3), the perceived likelihood of long term counts since the Y2K peak should have changed. It's high time we highlight the top competing long term counts. The only assumption among these scenarios is that all indexes are in sync in terms of their wave labels at "major" highs and lows. Let's begin.
"[IV]-large flat" - fresh lows before new all time high
Please see discussions and charts above regarding this count. Potential targets for the end of the hope rally are 1352.67-1378.31 and 1222.16-1228.74 in SPX. Please see Let's Recount (11/5/10) for details.
"[IV]-small flat" - most likely fresh lows before new all time high
This count sees the wave structure between the Y2K high and the 2009 low as a complete flat (Chart 4 and Chart 5). There are two variations within this count. The first variation is a zigzag supercycle wave (x) with the connecting cycle wave b likely to be protracted in time. The second variation is a multi-year complex supercycle wave (x) and the April high only concludes the initial primary wave [A].
The predominant implication is that the market will see fresh lows before any successful attempt at an all time high. Notably, in all likelihood, Nasdaq indexes will exceed their 2007 high before any attempt at fresh lows. Other than that, EWP does not offer an a priori structure for this corrective wave (x).


"[III]-unfinished" - new all time highs
This count sees the final stretch of the grand supercycle [III] is still ahead of us. The hope rally is the start of primary wave [5] of cycle wave V of supercycle wave (V).
Its implication is a multi-year bull market to new all time highs (Chart 6 and Chart 7). Please also see The Big Picture (U.S. Stocks) (2/21/10) for long term charts and discussions.


"[IV]-large triangle" - new all time highs before fresh lows
This count sees a multi-year sideways expanding triangle in the senior indexes (Chart 8). To be in sync with the senior indexes, the Nasdaq indexes likely will trace out a zigzag (Chart 9). Its implication is new all time highs fresh lows in at least the senior indexes.


Subscribe to:
Posts (Atom)