Disclaimer: Each post is for informational purposes only. It is not a solicitation, a recommendation or advice to buy or sell any security or investment product. Information provided in each post does not constitute investment advice.
Saturday, December 31, 2022
Friday, December 23, 2022
MTU Weekend Ed - Year End Action (12/23/22 close)
If the pullback this past week is wave two (blue) or wave B (green) in the form of an expanded flat, the low is likely in.
Otherwise, this 5 wave down (red) is the initial down leg.
Squiggles and how it might fit into the larger structure below.
Saturday, December 17, 2022
Sunday, December 11, 2022
Saturday, December 3, 2022
MTU Weekend Ed - Probing that resistance zone again (12/2/22 Close)
SPX is at its down trend line resistance and its previous resistance zone again, while the Dow once again closed its August high for a second week.
There is no change in the interpretation of the larger structure - see last week's post.
SPX is potentially at the end of wave 1 or wave A up this year's low (or the very bearish wave C of an irregular flat which fails to exceed the August high), particularly if the resistance holds (blue).
If we see an immediate strong rally (from retirement program inflows, holiday seasonals, improving sentiment on interest rate outlook, etc) which allows SPX to break above the resistance, we may be looking at a 3rd wave up (green).
Friday, November 25, 2022
MTU Weekend Ed. - Dow Exceeds August High (11/25/22 close)
The now closed the day and the week above its August 2022 high while SPX is more than 7% shy of its August high.
The larger price structure remains the same.
On the bearish side, the current upswing may be a part of a bearish flat, bearish expanding triangle or bearish contracting triangle, to conclude a corrective B wave.
On the bullish side, the current upswing has commenced a larger-degree wave (possibly wave five) to new highs, or the final leg of an expanding triangle to finish the blue [b]-up of 4-down. Note that in the latter case, the subsequent blue [c]-down of 4-down does not need to exceed the October low.
Sunday, November 20, 2022
Sunday, November 13, 2022
MTU Weekend Ed. - Continuation (11/11/22 close)
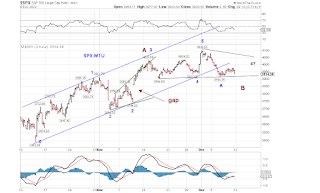
This past week saw a continuation of the initial upswing in Q4.
Chart 1 -
Potential target areas are 4200 and 4500 if this upswing is only partially correcting the 2022 decline, as a leg of an expanded flat or a bearish triangle.
New high if this upswing is the start of wave five up.
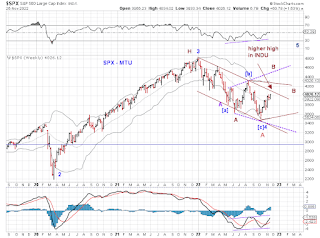
Chart 2 -
Index is still inside the down channel.
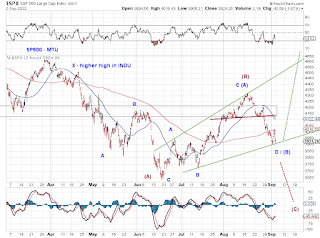
Chart 3 -
Short term, tracking 3 counts (coloured)
Saturday, November 5, 2022
Sunday, October 30, 2022
MTU Weekend Ed - Q4 swings (10/28/22)
[Chart 1 and 2] A potential triple zigzag from the ATH in SPX likely concluded at the recent low, given how much INDU has rebounded. INDU has now regained both SMA50 and SMA200 and SPX closed above SMA50.
Note the positive divergences developed over the past months, and the potential bull-flag from the ATH.
Potential targets to monitor are the upper end of the Q3 range (perhaps higher) in a counter-trend rally (as wave B up), or new high as wave 5 up.
[Chart 3] Short term tracking scenarios.
Saturday, October 22, 2022
MTU Weekend Ed - Upswing (10/21/22 close)
Chart 1- SPX broke out of a small-degree ending wedge and is now in an upswing.
Is the potential 4 done or will it stretch in time?
Chart 2- Is the current low Z or just [a] of Z ?
Chart 3- Short term tracking
Sunday, October 16, 2022
MTU Weekend Ed - Ending Patterns (10/14/22)
Chart 1 - The blue wave 4 (if it is one) is now wedging and is likely concluding.
Chart 2 - Can one make a five-up on last Thursday's rebound?Chart 3 - Potential ending patterns to monitor.
Friday, October 7, 2022
Saturday, October 1, 2022
MTU Weekend Ed - Triple Three (9/30/22 close)
Likely a triple three from the ATH, seen in INDU and SPX (Chart 1 and 2).
If the decline extends in both price and time, can be interpreted as a leading diagonal.
A low is insight, either as the end of the potential triple three or as the end of [a]-down of Z-down.
If the market decides to conclude a triple three, the current leg may be tracked as an odd-looking diagonal (Chart 3).
Chart 4 show how the present price structure can fit into the big picture.
Saturday, September 24, 2022
MTU Weekend Ed - BB bands (9/23/22)
SPX closed below its BB band, touched the lower band of its weekly and monthly BB band in a retest of the year low.
While SPX was just shy of breaching the year low this past Friday, the Dow did.
For SPX to complete a large wave 4-down from its ATH, it likely needs to tread sideways to trace out a terminal triangle (blue).
A continued decline would complete a potential triple-three (leading expanding diagonal?) from the all-time high.
Sunday, September 18, 2022
MTU Weekend Ed. - ... of Two Wedges (9/16/22 close)
Two potential wedges in SPX, one bullish and the other bearish. Neither may materialized and each can morph into a double zigzag.
Sunday, September 11, 2022
MTU Weekend Ed. - 2/4 line (9/9/22 close)
SPX has been respecting the tentative wave 2 - wave 4 line (Chart 1 & 2)
Reactions near the prior HS neckline and the previous support/resistance zone will be informative (Chart 3)
Saturday, September 3, 2022
Saturday, August 27, 2022
MTU Weekend Ed. - Bearish Short Term Setup (8/26/22)
The gray box in the Chart represents a support-resistance zone in SPX.
SPX has delivered a false upside breakout with respect to the support-resistance zone indicated by the gray box in the Chart.
This past Friday, SPX closed at the low of the daily and weekly bar, below the zone, as well as the neckline of a small head-and-shoulders setup.
The green wave 4-dn serves as a bear trap.
Saturday, August 20, 2022
MTU Weekend Ed - Reaction (8/19/22 close)
SPX peaked and SMA200 and is now retesting a prior resistance zone, now potential support.
The blue count (ABC up) anticipates at least a deep, if not an entire retrace.
The bullish count have the high as the top of a 3rd wave or wave 1 or a 3rd wave, implying different retrace amounts.
Saturday, August 13, 2022
MTU Weekend Ed. - Break above Resistance (8/12/22 close)
SPX closed above its Jan-Mar support and has recovered its June loss (Chart 1).
Monitor if this is ABC or 123.
C-up may conclude soon or can morph into an much extended one that parallels 3-up (Chart 2).
Sunday, August 7, 2022
MTU Weekend Ed - Approaching Resistance (8/5/22 close)
SPX is approaching its January low from below.
Price actions in the first week of August did not break SPX above its June high - still inside bars so far.
Three waves up from its June low so far.


