Disclaimer: Each post is for informational purposes only. It is not a solicitation, a recommendation or advice to buy or sell any security or investment product. Information provided in each post does not constitute investment advice.
Sunday, October 16, 2022
MTU Weekend Ed - Ending Patterns (10/14/22)
Chart 1 - The blue wave 4 (if it is one) is now wedging and is likely concluding.
Chart 2 - Can one make a five-up on last Thursday's rebound?
Chart 1 - I dont know where you get these counts from MTU. Where does your wave 1 start from (ie what point is 0) ? Is a computer program generating them ?
That count might be possible if the scale of the wave seq you have is unfolding and its distorted, but how many wave 3's are shorter in time period than wave 1 ? Never seen one amigo.
2009-2018 = 8 yrs for wave 1 there and 2018-2021 = 3 yrs for wave 3.
Chart 3 - Clearly there are 5 waves down from the mid August peak there but the question is has the 5 completed on 1 October / late Sept, or is it still in progress ?
Then you look at the implications of that and pattern for the larger deg waves.
The wave form on SPX and other indexes is distorted anyway from what it should look like.
Once you realize whats before you 'All roads lead to Rome' as they say.


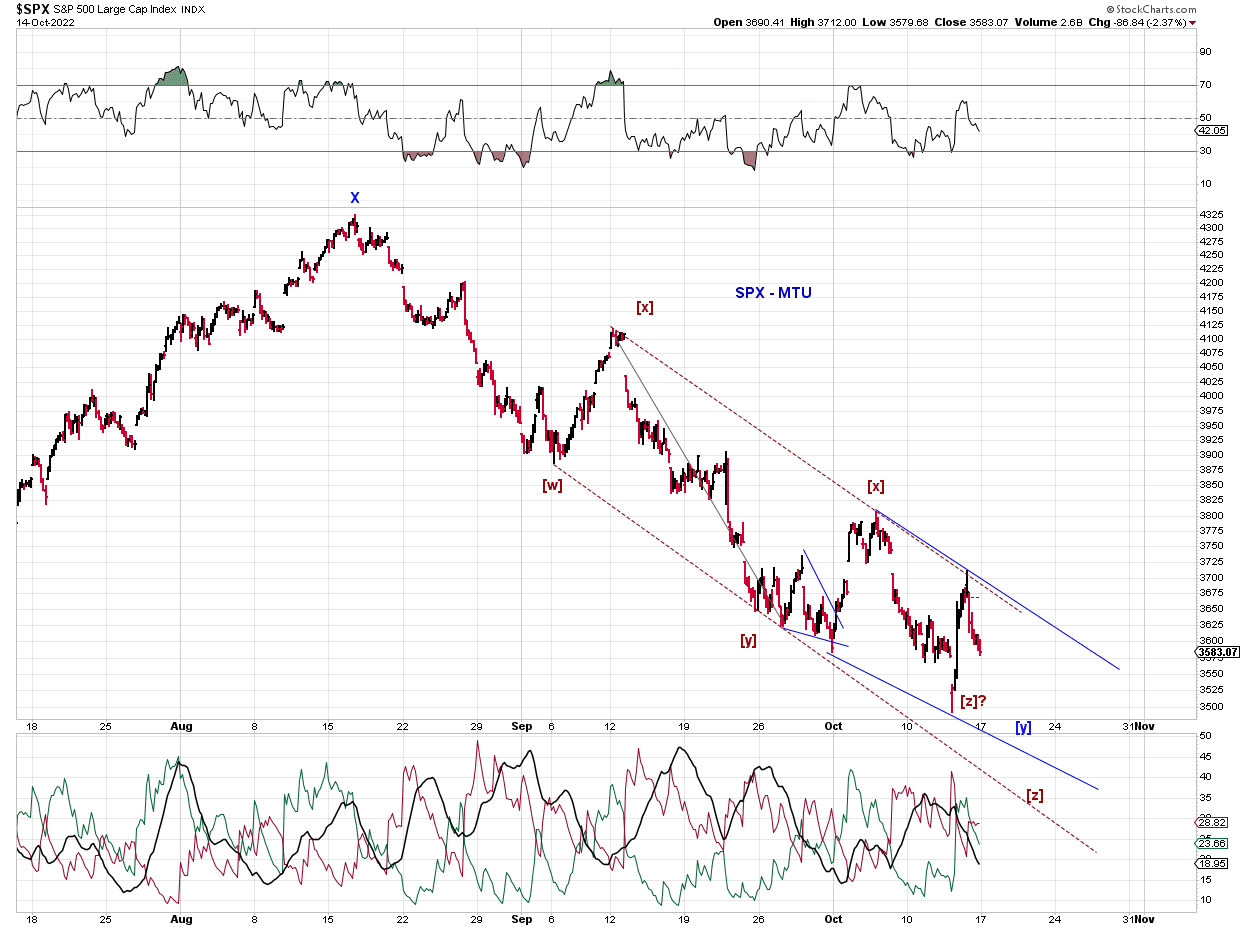
Chart 1 - I dont know where you get these counts from MTU. Where does your wave 1 start from (ie what point is 0) ? Is a computer program generating them ?
ReplyDeleteMentioned this structure initially here
Deletehttps://market-timing-update.blogspot.com/2022/05/mtu-weekend-ed-wave-four-51322-close.html
That count might be possible if the scale of the wave seq you have is unfolding and its distorted, but how many wave 3's are shorter in time period than wave 1 ? Never seen one amigo.
Delete2009-2018 = 8 yrs for wave 1 there and 2018-2021 = 3 yrs for wave 3.
Chart 3 - Clearly there are 5 waves down from the mid August peak there but the question is has the 5 completed on 1 October / late Sept, or is it still in progress ?
ReplyDeleteThen you look at the implications of that and pattern for the larger deg waves.
The wave form on SPX and other indexes is distorted anyway from what it should look like.
Once you realize whats before you 'All roads lead to Rome' as they say.
Q MTU - with waves, if wave 3 is extended should wave 1 & 5 be the same/similar length ? Is that the observed situation.
ReplyDelete