The European sovereign debt crisis is back in focus in recent days. Since SP500 and DAX have been tracking each other well, taking another look at the German DAX can shed light on U.S. stocks. For example, the correlation between SP500 and DAX is obvious as shown in Chart 1.


Whether the sell-off over the past two months is an wave X pullback (Chart 1, blue) or a bearish trend change (Chart 1, red) in DAX requires further confirmation. However, the price pattern (wave structure) in DAX from its March high is reasonably well formed.
More interestingly, the long term price pattern of DAX is telling. From its Y2K high, DAX appears to be in a generational triangle consolidation (Chart 2).
If the 2009 low holds, one of several ascending triangles is likely at play (Chart 2, blue, dashed blue, green). The end of the proposed triangle (i.e. wave e) is likely to coincide with the worst market sentiment regarding the European sovereign debt crisis.
If the 2009 low fails, key possibilities are a larger triangle (Chart 2 gray), a flat (Chart 2 purple) or a much more bearish development (Chart 2 red).
SP500
Meanwhile, SP500 continues to find support from a decade long support/resistance area (Chart 3) and appears to be wrapping up a two-month consolidation (Chart 4). Until this changes, odds appear to favor the bullish interpretation.

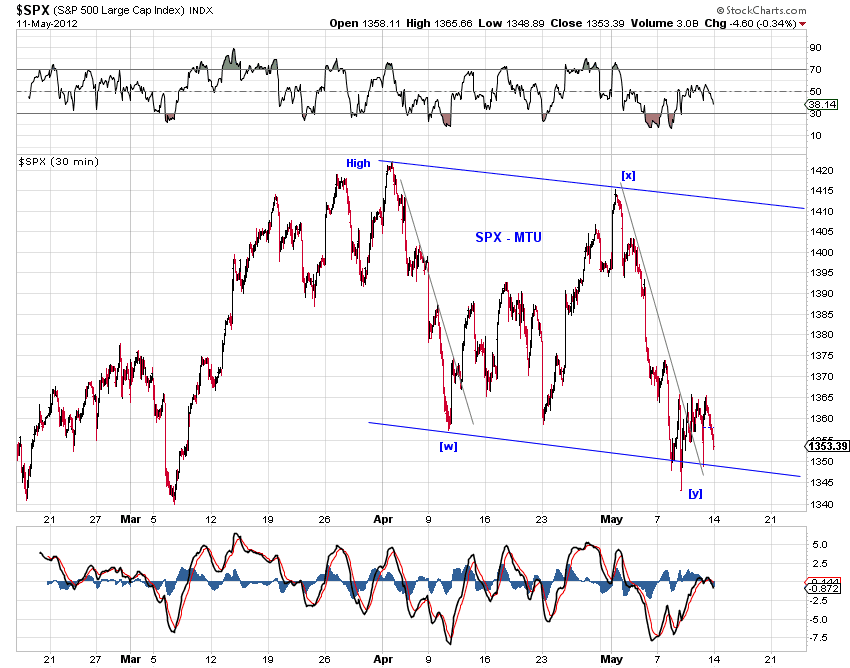
Moreover, price structures across major U.S. stock indexes have so far retained the "right look" of a 4th wave or B wave consolidation (Chart 5). In transports (Chart 5, bottom panel), we have what appears to be a lengthy triangle wave (B).

For near term outlook, please see Market Timing Update (5/11/12).