Much of what needs to be said is in the 130pm entry below.
Here's wider look on the daily time-frame.
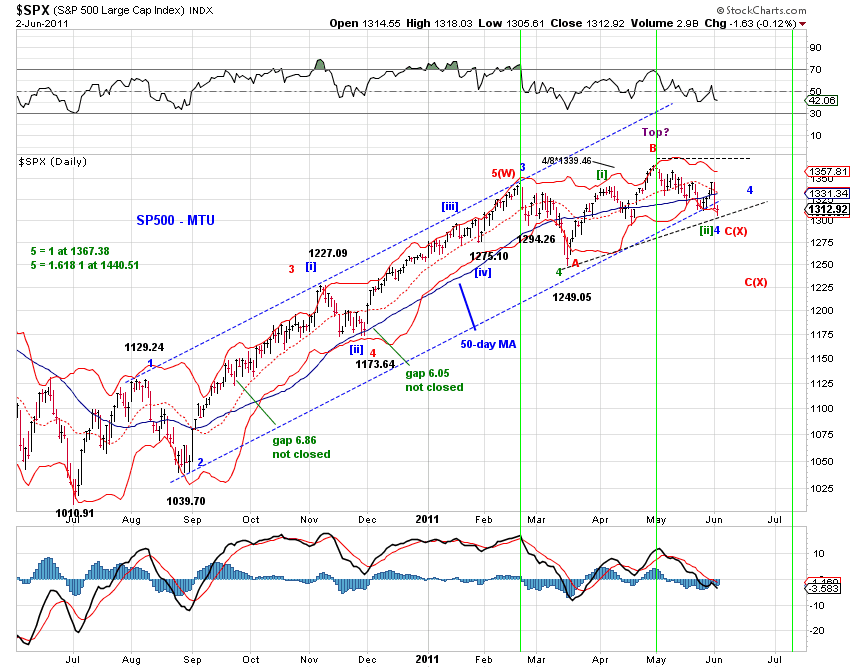
[130pm] Count update (SPX, ES) -
 Tracking counts on SPX - blue, purple, red (Chart 1)
A word on the Fractal mapping - leave room for an expanding triangle as outlined by the red lines in Chart 1 and Chart 2. In other words, the near term low could be point 7 (works better for $RUT) or point 5 (remains a possibility for $SPX) of the fractal in SPX. Also see tglacour's comment here.
And finally, an update on ES squiggles (Chart 3).


[1025am] Squiggle update (ES) -
see the 2nd chart below
[9am] Overnight update (ES) -

