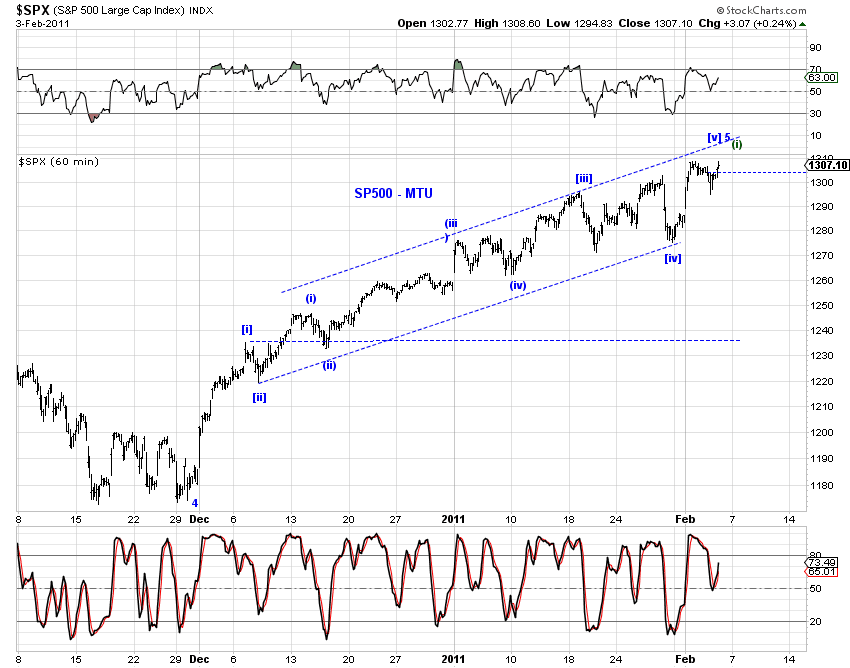
Stocks - While the possibility of further extension of the current wave at a couple of degrees exists (see the green counts in Chart 1 and Chart 2), the wave structure does look quite complete at a couple of degrees (with perhaps one more squiggle high overnight and Friday AM). See the blue counts in the following charts.


 Bonds - This chart shows two competing counts for TLT on its sell-off since the September 2010 high. A five-wave decline has either ended in December 2010 (green count) or is ending soon (blue count). If the green count plays out, a minor degree wave 2-up rebound is tracing out an expanded flat. If the blue count plays out, the current fresh low is likely wave (d) of and ED wave [v] of wave 1.
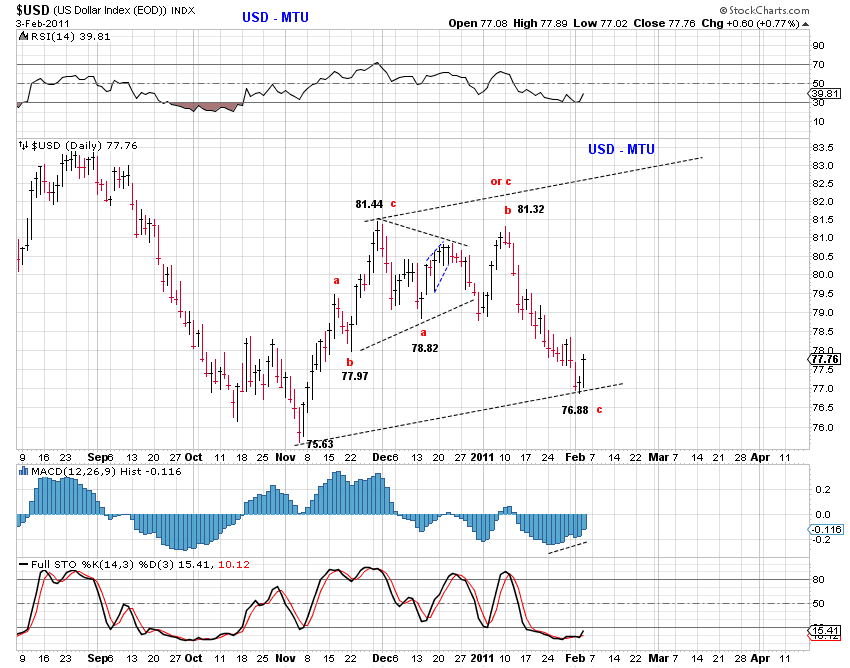
USD - The USD index has reversed its near term trend smartly, while the larger count remains ambiguous. We'll focus on one wave at a time.

 Gold - The primary count on Gold is that a multi-month 4th wave has just ended. If it is the case, the 5th wave advance is likely to extend given the relative size between the 1st and 3rd waves.
 [1030am] Count update (stocks and USD)-
The high is in or a second wave retrace in stocks. USD is doing well.


[8am] Overnight update -
