 [EOD] USD, in reply to td12 -
Here's a historical chart on DX.
[210pm] ES Squiggles -

[1220pm] Count update (SPX) -


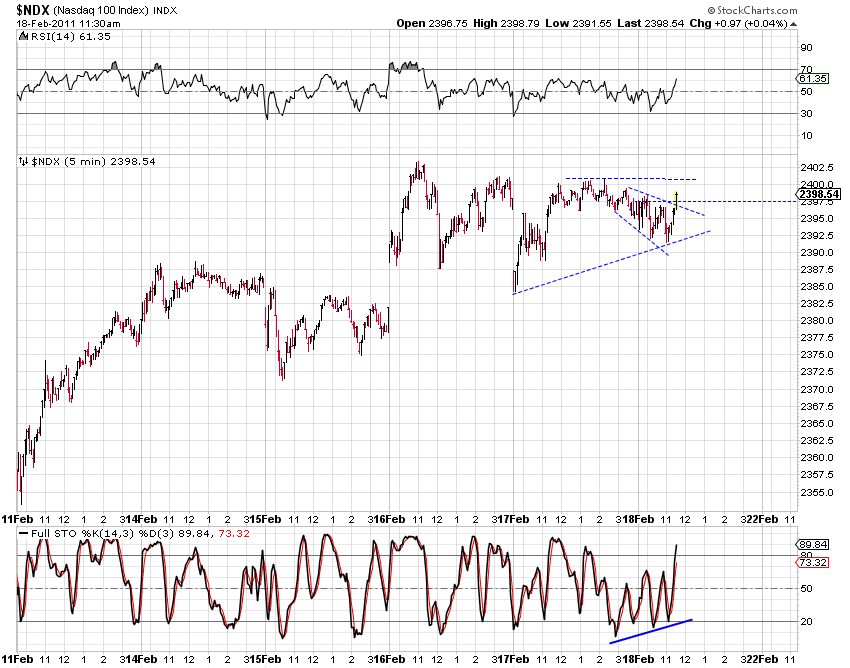
[1130am] Apple and NDX -
 thoughts regarding td12's comment on Apple (the largest component of NDX), here is a near term count. One can map the spirit of the count to NDX for the near term as well.
 [730am] Overnight update -
In stocks, the current assessment is that the green ED discussed in yesterday's update is likely tracking. The overnight decline is a three so far and wave e of the ED is likely in progress. If so, we could see the ED being completed today.
In the USD index, a potential upward turn may be in progress.

