Squiggles on NDX and ES count better as a five up. While the squiggles on the SP500 cash index leave open the possibility of a three up from the recent low.
To maintain the right form/look in conjunction with the above observation, a reasonable thing to do is to mark the coming high is [iii] of 5 in SPX and (iii) of [v] of 3 in NDX - in other words, we are shifting the peaks discussed yesterday to the right for two days. Most likely, the proposed local peak will show up overnight and tomorrow. See charts.


The bearish alternative is that [iv] of 5 in SPX and (iv) of [v] of 3 in NDX ended at today's low - or are still in progress as flats or triangles (but how does one accommodate the potential impulse up today?)
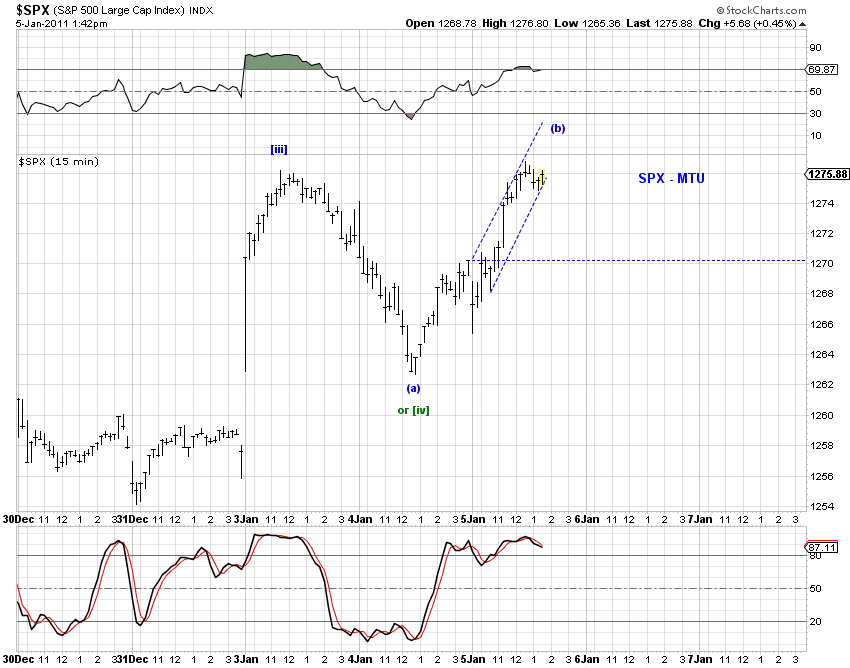
[142pm] SPX squiggles -
Bearish - expanded flat or triangle, Bullish - [v] is in progress; see the 2nd chart below
[1120am] SPX squiggles -
Bearish count if the low of [iv] is not in (as in a triangle). The pullback so far is relatively shallow and brief. The low could stand if it morphs into a triangle.

 [810am] Overnight update (ES) -
The proposed wave [iv] (black) has retraced a bit more than 0.236 fib. It could have one additional leg down (say, as c of (c) of [iv]), which may not be necessary depending on how one counts the overnight decline.