The primary trend remains down. The decline from the April high to date is most likely the initial sell-off of a renewed multi-year bear market, and at best, an incomplete correction.
Within this context, the rebound (up 6.65% in SPX from the lows) over the past six days is merely a rebound within a bear trend.
An update on the top four competing counts
The four top competing counts which were discussed in detail in You Are Here (7/2/10) and are updated in Chart 1 here are still tracking the market well. The 6/21/10 high (1131.23 in SPX) remains a key level to differentiate these four top competing counts. Please see the previous MTU Weekend Edition for a detailed description of these counts.
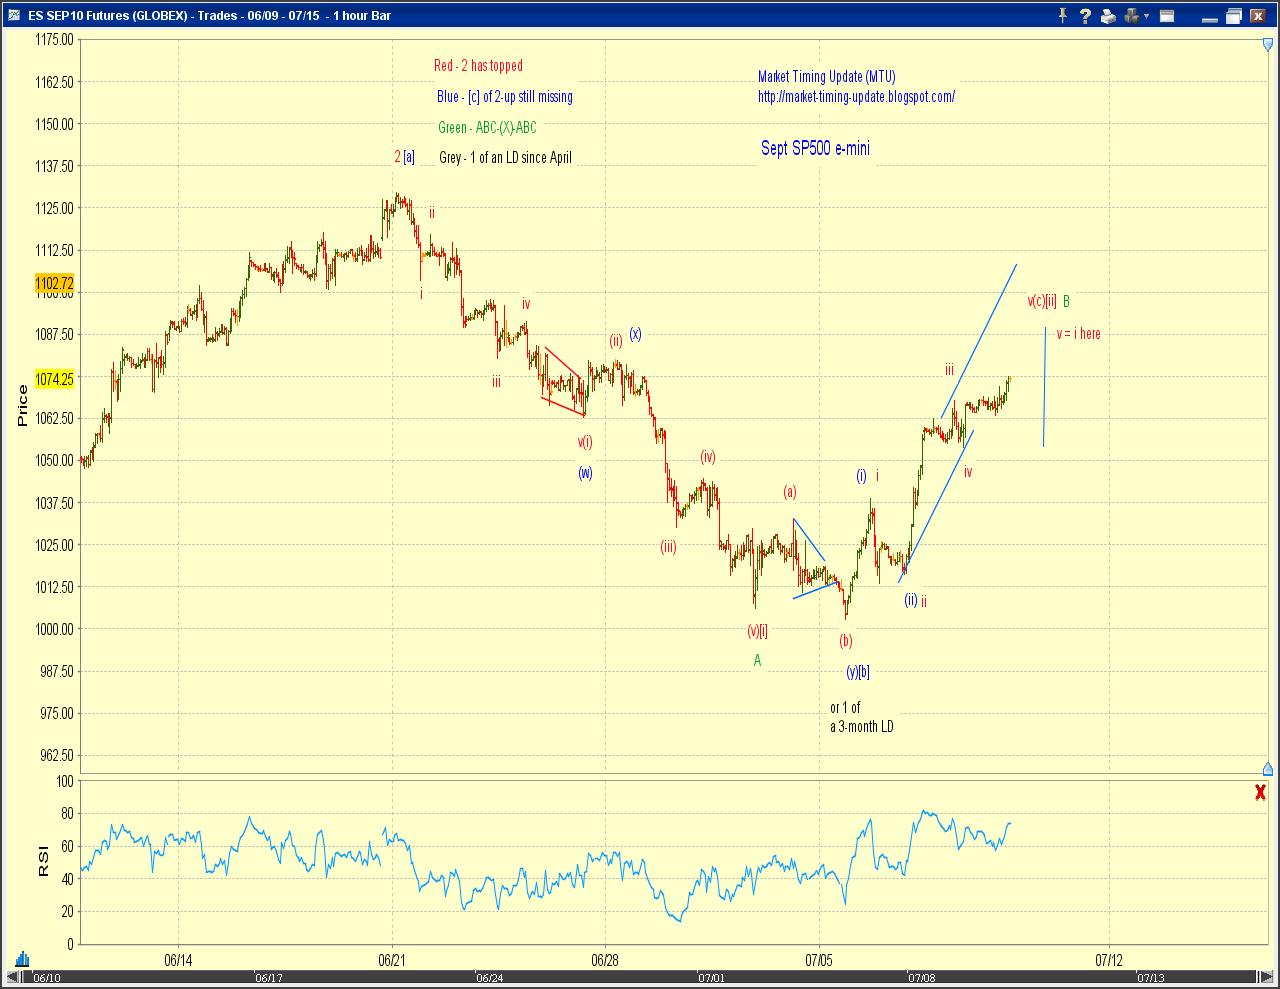
Note that the most bearish count (red labels in Chart 1) calls for a forceful sell-off (as [iii]-down of 3-down of (1)-down of P3) directly ahead. (Doesn’t it always?) See Chart 2 for a squiggle count on the Sept SPX e-mini contract.

One more interesting and relevant count!
I was intrigued by a chart in an Op-Ed piece in today’s Wall Street Journal (Chart 3). The chart compares P2 and now the start of P3 with the boom-bust of 1936-1937-1938. The self-similarity is visually striking.
If history repeats and rhymes, there should be additional decline in store and this initial sell-off (as minor wave 1) of P3 should take more time to complete before minor-degree wave 2 rebound surfaces. If this scenario plays out, expect SPX to drop to low-to-mid 900s before finding potential support.
Along this line of thought, a logical count is an even larger leading diagonal. See Chart 4.


No comments:
Post a Comment