 [EOD] SPX - Today's sell-off has painted a nicely formed five wave down (which appears incomplete as of the 4PM close). The top may be in according to one count or SPX is completing wave (c) of an expanded flat wave [iv].
 Chart 1 of yesterday's update highlighted the top three near term counts. Today's decline has rejected one count (blue), brought an immediate completion to the second count (green) and tracked the third count (red).
Chart 1 offers an update of the advance since early Feb. The green labeled count recognize yesterday's high as the P2 top. The red labeled count suggests that SPX is only approaching the end of an expanded flat wave [iv].
Chart 2 offers a more detailed count on the 30-min scale, where one can see a nicely formed five wave decline.
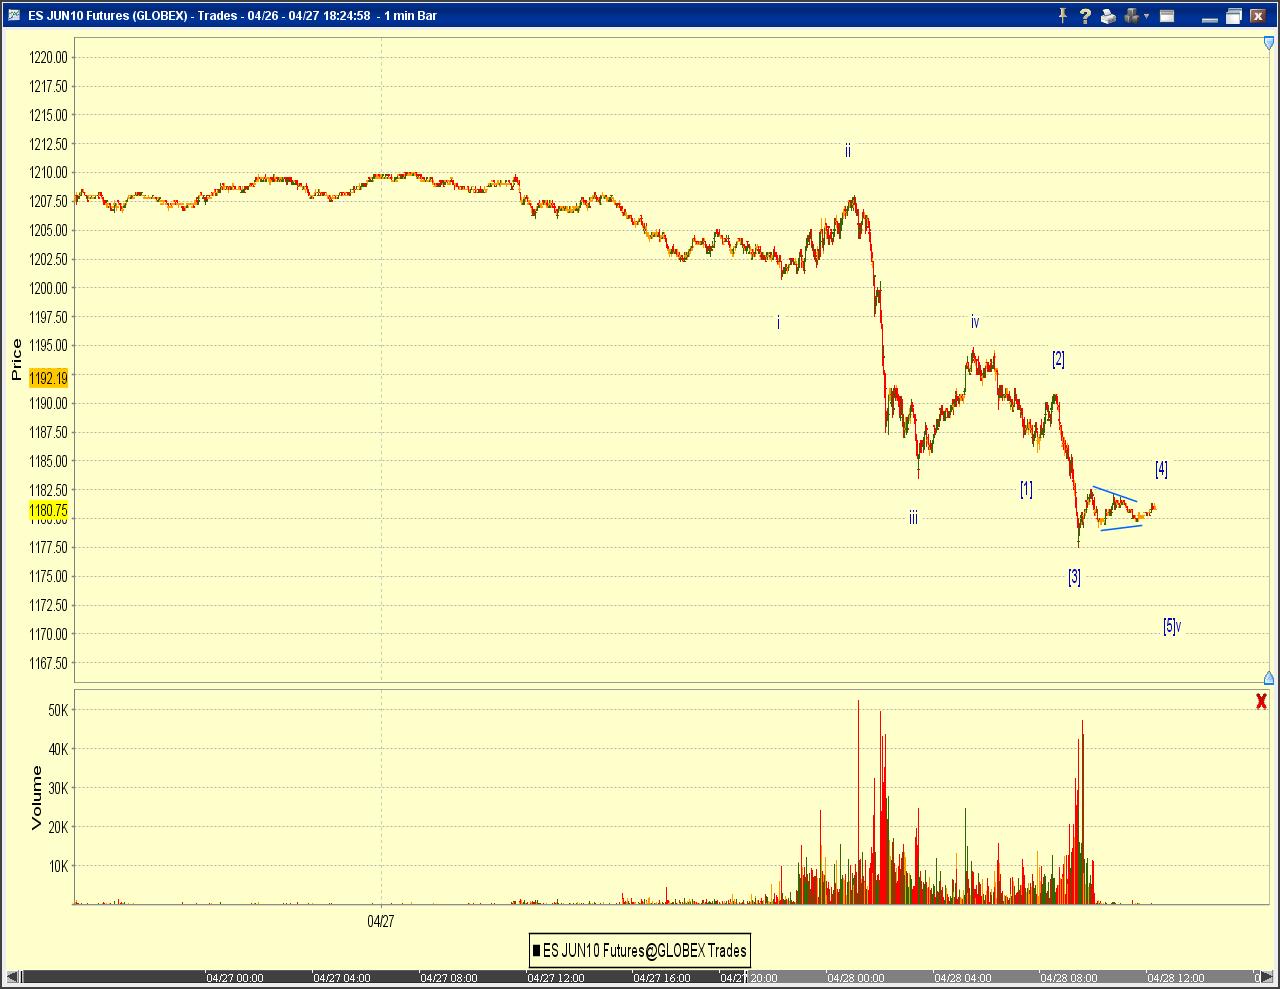
A squiggle count on the 1-min scale (Chart 3) suggests the potential of a five-of-five ([5] of v) decline overnight or early tomorrow morning before a rebound can surface.


No comments:
Post a Comment