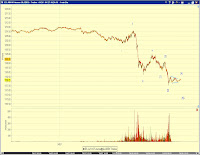
The month of April ended with an eventful week - S&P downgrades on Greece, Portugal, and Spain; and the U.S. criminal probe into Goldman Sachs' mortgage trading (See Time Line). SPX lost 2.51% for the week but gained 1.476% for the month.
Regarding the larger picture, the primary degree rally since last March has either topped (or nearly so, and with diverging tops in large and small caps, after another minute degree advance) OR has one more minor degree advance after the current pullback is complete, DEPENDING ON which wave label – (X) or B – is correct regarding the 2/5/10 low.
Subjectively, I’m sympathetic with expectation of a new rally high before the market tops. With the “nearly topped with diverging tops” interpretation, a target range may be 1235-1245 in SPX; and with the “correction” interpretation, a target range may be 1255-1275. But strategic bears are certainly content if the top is indeed in place. See discussions below.
Topped – The primary degree rally since last March may have already topped if it takes on the particular triple-three form of zigzag-(X)-zigzag-(X)-flat (Chart 1). The blue labels in Chart 2(SPX) and Chart 3 (RUT) present a detailed count of C of (Z) on the 60-minute chart. Both SPX and RUT sport an expanding diagonal top, which is reportedly rare.
In addition to the impulse wave declines over the past few days, the other piece of supporting evidence is that FTSE100 has likely seen its top (Chart 4). See detailed discussions on FTSE100 in A potentially major turning point (4/9/10), Turning (4/16/10), and Targets for a good turn (4/23/10).
Nearly topped with diverging tops– The green labels in Chart 2(SPX) and Chart 3 (RUT) present a potential pair of diverging tops in large cap indexes and small cap indexes - a regular [v] of C(Z) in SPX and an expanding diagonal [v] of C(Z) in the RUT - that still require one more minute degree advance before topping. The diverging tops become a necessity at the moment in terms of wave counts as the RUT has already declined below its 4/27 or 4/28 low while SPX has not, so far.
A correction – If the primary degree rally since last March is a triple zigzag as shown in Chart 5, the current pullback should be just a minor degree B wave of (Z). When B-down of (Z) is complete, a final minor degree C-up of (Z) will push the market to new highs to conclude the primary degree rally.
Chart 6(SPX) and Chart 7(RUT) present a detailed count of waves A-up and B-down (to date) of (Z). The correction is NOT yet over (in time and most likely in price as well) under this interpretation. Expect SPX to decline to 1150-1170 area before finding support.
*****Appendix
Regarding the near term price actions, the 4/28/10 low could hold in SPX and INDU, but not in RUT (which has already dropped below it) and COMP (which has suffered extremely deep retracement).
Disclaimer: Each post is for informational purposes only. It is not a solicitation, a recommendation or advice to buy or sell any security or investment product. Information provided in each post does not constitute investment advice.
Friday, April 30, 2010
Thursday, April 29, 2010
Market Timing Update (4/29/10 Close)
SPX is likely to have additional near term upside potential while the RUT looks ripe for a turn. See discussions below.
SPX-
The expected deep retracement discussed in yesterday's update has materialized. The rebound is likely incomplete. The likely incomplete rebound, breadth and volume tend to support a new high in the form of wave [v].
Chart 1 shows the top three counts on the SPX since its early Feb low.
[Blue] A new high in the form of a wave [v] up.
[Red] Wave B-down of (Z) is in progress and the current rebound is (b)-up of B-down.
[Green] The top is in. The current rebound is (ii)-up.
Chart 2 updates the squiggle count since the recent peak.
[Green] There's a small chance that today's high marks the end of the wave (ii) rebound, which has traced out a flat-x-flat when taking into account of overnight price actions. But this scenario is far from certain as
(1) the competing counts are as compelling if not more, and
(2) the decline from today's high is not as impulsive as desired and stopped right around EW guideline supports, and
(3) the fact that the RUT made a higher high into the close.
The market needs to sell-off immediately to validate this interpretation.
[Red and Blue] These counts both suggest additional upside potential after this small degree 4th is complete.
RUT -
Chart 3 and Chart 4 offer the primary count for the RUT. The RUT looks ripe for a turn though. The recent high in the RUT (749.95 on Apr 26) is close to the fib target of 753.34 discussed in Targets for a Good Turn (4/23/10), and the wave count looks complete.
Wednesday, April 28, 2010
Market Timing Update (4/28/10 Close)
In the large cap indices at least, the market reveals little as to where the recent low is wave (c) of [iv] or (i) of a P3-like scenario. So I continue to discuss both scenarios here. The rest of the week should be telling, hopefully.
In SPX, the wave structure has so far been reasonably text-book style. The challenge is that the rebound counts either as an impulse up or a regular upward flat. As such, the two counts track each other very closely with exceptions at very small degrees which is inherently ambiguous.
Either way, I'd expect a pretty deep retracement/rebound as a third wave up is most likely in progress according to either count.
Chart 1 - Two top counts in the SPX since the Feb low (updated)
Chart 2 - Wave counts of price action since the recent top.
Chart 3 - Squiggle count of today's rebound.
Tuesday, April 27, 2010
Market Timing Update (4/27/10 Close)
[Update 625PM] A potential small degree triangle wave [4] of v forming in the Emini. This chart updates Chart 3 below.
[EOD] SPX - Today's sell-off has painted a nicely formed five wave down (which appears incomplete as of the 4PM close). The top may be in according to one count or SPX is completing wave (c) of an expanded flat wave [iv].
Chart 1 of yesterday's update highlighted the top three near term counts. Today's decline has rejected one count (blue), brought an immediate completion to the second count (green) and tracked the third count (red).
Chart 1 offers an update of the advance since early Feb. The green labeled count recognize yesterday's high as the P2 top. The red labeled count suggests that SPX is only approaching the end of an expanded flat wave [iv].
Chart 2 offers a more detailed count on the 30-min scale, where one can see a nicely formed five wave decline.
A squiggle count on the 1-min scale (Chart 3) suggests the potential of a five-of-five ([5] of v) decline overnight or early tomorrow morning before a rebound can surface.
Monday, April 26, 2010
Market Timing Update (4/26/10 Close)
SPX & RUT update
SPX- Chart 1 highlights the two top counts of the advance since the Feb low. I favor the impulse wave (blue). Near term, there are three top scenarios as highlighted by the blue, red and green lines in Chart 1. Chart 2 offers a squiggle count of the near term action.
RUT- Chart 3 offers the primary count of the advance since the Feb low. Squiggle count suggest a (v) of [v] in the cards (Chart 4).
Friday, April 23, 2010
MTU Weekend Ed. - Targets for a Good Turn (4/23/10 Close)
In A Potentially Major Turning Point (4/9/10), I discussed wave counts that place the end of the rally from the early February lows as the end of the bear market rally (P2) in a diverse group of indices – foreign, domestic large cap and small cap. The highlighted indices are FTSE100 (Chart 1), SP500 (Chart 2) and Russell2000 (Chart 3).
Recent price actions suggest that the advances since the February lows in these indices are indeed in their late stages. Chart 4 to Chart 6 present my preferred count of the advance since the February lows. In terms of the wave structure since the February lows, FTSE100 and SP500 have extended third waves and Russell2000 has an extended fifth wave. I also offer the following projected targets. Given the market and sentiment internals, the market could very well turn below these levels.
FTSE100 – I mentioned that FTSE100 has less than 5% upside potential from the 4/9/10 close of 5770.98. It reached as high as 5833.73 on 4/16/10 and closed at 5723.65 this Friday, not far from the 4/9/10 level. The original cap on FTSE100 remains applicable.
SP500 – [v]=[i] at 1218.46 and [v]=1.618[i] at 1239.95.
Russell2000 – [v]=1.618[i to iii] at 753.34
Appendix - squiggles reveal a bunch of threes.
Thursday, April 22, 2010
Market Timing Update (4/22/10 Close)
SPX - Chart 1 below updates the three competing near term counts discussed in recent updates. At the moment, I am leaning towards the triangle count (blue), as well as the bearish count (red), mainly due to the squiggle count shown in Chart 2 below. Rising above today's high will practically confirm the immediately bullish count (green) or its variations.
Wednesday, April 21, 2010
Market Timing Update (4/21/10 Close)
SPX- The expected bearish price action discussed in yesterday's update did surface today.
However, the decline so far looks corrective, as tracked by the green-labeled count. This would suggest new recovery highs. A rise above today's high near the open offers practical confirmation.
For the two bearish counts (red and blue labeled counts) to work, one needs to interpret today's decline as [1]-[2]-(1)- or a LD [1]-down. As such, today's high near the open should not be violated.
RUT- A potential count of the RUT, appears to be missing one more higher high to conclude the run according to today's intraday count.
Tuesday, April 20, 2010
Market Timing Update (4/20/10)
[P.S. Chart 2, ED over-throw after Apple earnings release in the after hours]
SPX- With additional follow through of the rebound today, the rebound (or the first leg of the rebound in terms of Green labeled count discussed below) is most likely over. Based on the analysis below, I expect bearish price action in the short term, the duration and the magnitude of which depends on which count plays out.
All three competing counts are still on the table. Chart 1 offers an update. Note that price action this afternoon most likely suggests an ending diagonal, which is a terminal movement.
[Red-bearish] (ii)-up should be done overnight. Expect (iii)-down to surface tomorrow.
[Blue-ultimately bullish] [b]-up of B of (Z) should be done overnight. Expect [c]-down of B(Z) to surface tomorrow.
[Green-immediately bullish]
1. Please see yesterday's Chart 3 which illustrates the larger wave structure that accommodates this interpretation.
2. (i)-up of [v]-up should be done overnight. Expect (ii)-down of [v]-up to surface tomorrow.
3. Potential targets: [v]=[i] at 1218.46
Monday, April 19, 2010
Market Timing Update (4/19/10 Close)
In terms of the near term wave count, I see three competing possibilities. The validity of each count depends very much on whether one interprets the initial advance from the low is impulsive or corrective. See the portion of Chart 1 as indicated by the circle.
Chart 2 highlights the three competing counts.
[Red-bearish] Wave (i)-down from the recent peak concluded at today's low. Wave (ii)-up is an upward flat and is in its late stages.
It's also possible to mark the first low of the day as (i), and call wave (ii) an expanded flat. The latter count suggests relatively more upside potential for (ii)-up.
[Blue-ultimately bullish] Wave B-down of (Z) is in progress. Today's advance is (B)-up of B. (C)-down of B should start this week at levels below the prior peak.
[Green-immediately bullish] Today's low is the end of wave [iv] with respect to the 2/5/10 low. Chart 3 illustrates the larger wave structure that accommodates this interpretation. Today's low should not be violated. Technically, wave [iv] can be more complex with today's low as only the first portion of wave [iv]. In that case, the wave structure since Feb effectively becomes the same as the B of (Z) interpretation.
VIX- It should be pointed out that VIX has yet to achieve a five up from its recent low (Chart 4). The rise in VIX earlier today failed to eke out a higher high.
Friday, April 16, 2010
MTU Weekend Ed - Turning (4/16/10 Close)
April 16th is the anniversary of the post-crash bear market rebound top in 1930. From Nov-1929 to 4/16/30, the Dow rallied 52.14% and retraced 53.43% of the Sep29-Nov29 stock market crash. However, the bear market resumed after that day and had subsequently fallen 86.34% to the 7/8/32 bottom.
On this anniversary in 2010, the Dow dropped 1.13% on news that SEC charges Goldman Sachs (-12.79% on Friday) with fraud. Friday’s market decline has erased most of the gains for the week, leaving the Dow up only 0.19% over the past week.
As discussed in A Potentially Major Turning Point (4/9/10), the stock market is in the process of a major turn. Even if there should be another recovery high in coming weeks, the big-picture message remains unchanged. See discussions below.
Update on FTSE100: Topping
In last week’s commentary, I concluded that there should be less than 5% upside potential for the FTSE100 based on either bullish or bearish counts (Chart 1, reproduced, not updated). Chart 2 updates the wave count for the advance since early February. The red labeled count calls for a completed ED and the top. The blue labeled count suggests a final wave [v]-up after wave [iv]-down is complete. Note that the FTSE100 and SP500 have been highly correlated and have very similar wave structures.
Update on SPX: Turning
The advance since early February could have already ended or there could be one more small-degree 5th wave up (Chart 3). The decline on Friday has not yet revealed enough wave structure or broken all support levels to offer confirmation (Chart 4). We should be able to have clarity early next week.
From last Friday’s low to this Friday’s high, the VIX index has surged 29.34% or 4.43 points. The VIX has clearly broken out of its near term base channel (Chart 5). It’s an indication how vulnerable the market can be at this late stage of the bear market rally.
Chart 6 and Chart 7 offer detailed squiggle counts based on the short term bearish and bullish count discussed above. To support the immediately bullish scenario (Chart 7), which interprets Friday’s decline as (iv)-down of [v]-up with respect to the early February low, the 1170-1175 range needs to hold.
In terms of the big picture, odds favor the coming turning point as the end of the rally since last March, and the end of a triple-three wave structure (Chart 8). The competing count is that the coming turning point is only A of (Z), with another rally to new highs following a moderate near term pullback (Chart 9). The profile of the expected near term decline will help us identify the right scenario.
Subscribe to:
Posts (Atom)