Tuesday, March 31, 2020

Tuesday Update (3/31/20)

Here we go.   Blue wave [4] is at 50% retrace of the last leg down from 3136.72 to 2191.86


Friday, March 27, 2020

MTU Weekend Ed. - Rebound or Bull Trap (3/27/20 close)

We explored longer-term bullish scenarios in Near Term Bottom Fishing (3/20/20). This post explores longer-term bearish scenarios in more detail. 

It can be argued that we have a completed five waves up from the 2009 low to the nominal all-time high  (Chart 1). 

Chart 2 provides a more detailed count on wave [iv]-down of 5-up, as a (w)-(x)-triangle structure often seen in recent years amid market exuberance.

Also note that the plunge in the Dow has already overlapped its wave 3-up  (Chart 3), which increases the likelihood that this is a larger degree retrace.

This could be the end of a larger degree wave (5)-up or just 1-up of (5)-up (Chart 4).  In either case,  a correction of the 11-year run from 2009 to 2020 could be running and is unlikely to have lasted only 6 weeks.


For the near term, we have an impressive bullish weekly candle (Chart 2 above) but SPX is still pressured by the downward trend line until it is broken.  For short term tracking, we are monitoring the possibility of a fresh upswing (Chart 5 purple and green)  or a fourth wave flat (Chart 5 blue)


Wednesday, March 25, 2020

Wednesday Update (3/25/20)

[EOD Update]- see intraday update for description
[Intraday Update 1pm NYSE]- More clarity with additional price prints, the low is in (purple (C)) or not (blue [4])

Tuesday, March 24, 2020

Tuesday Update (3/24/20)

 [EOD Update]
Chart update to include additional price prints.  See intraday update for descriptions.


[Intraday Update, 1:20pm NYSE]
There is more clarity with additional price prints.
Tracking counts
The near term low is in - purple
Bull trap - red and Chart 2 (expanding EDT yet to complete)
Killing time - blue wave [4]-up


Monday, March 23, 2020

Monday Update (3/23/20)

[EOD Update] -
Tracking counts. A large contracting EDT wave (C)-down has the best visual form so far (Chart 1 purple, Chart 2). The floor is 2016.6 as labeled on the chart.

An expanding EDT wave [5]-down requires another leg lower to exceed 2184.51 (Chart 1 red, Chart 3). The numbers for a contracting EDT wave [5]-down do not work out (missed by about 2 index points at today's low.)

Then there is the possibility of a complex wave [4]-up to take up more time and to alternate with wave [2]-up for the impulse count (Chart 1 blue).
[Intraday Update - 10:30am NYSE] -
Here we go, see previous updates for discussion.


Friday, March 20, 2020

MTU Weekend Ed - Near Term Bottom Fishing (3/20/20 close)

Major cash indexes did not make a lower low on Friday.  That leaves the option of a completed zigzag ending with an EDT (Chart 1 green) or yet to complete EDT for finish the zigzag (Chart 1, blue).  The floor of the blue EDT is 2016.6 as marked on the chart.


Regarding prospects of a longer-term bearish scenario, an impulse down is yet to form, perhaps along the lines of the blue [4]-up and [5]-down in Chart 2 (blue).

Regarding prospects of longer-term bullish scenarios, the following two tracking counts (Chart 3 and Chart 4) offer some possibilities.


Thursday, March 19, 2020

Thursday Update (3/19/20)

SPX did not make a lower low, nor a higher high today. 

Although yesterday's low can be counted as a/the low  (Chart 1, green (C), blue 5(C) or [3],  red [5]),  the bulls are not out of the woods yet in terms of a confirmation to the upside.  

A larger contracting diagonal in SPX (Chart 1 purple (C), Chart 2)  and a larger expanding diagonal in ES (Chart 3) are still on the table.   

Chart 3 - Although wave E-down of (C)-down in ES now looks like a potential EDT, the numbers do not work out, it's likely [a]-triangle-[b]-[c] as marked on the chart.


Wednesday, March 18, 2020

Wednesday Update (3/18/20)

[EOD Update]
Here we go.

Chart 1 - ES expanding EDT wave (C) still on the table.  Today's low on the March contract is 2274.75 - getting close  to the expanding EDT spec. 
Chart 2 - Tracking counts.

Chart 3 - Details of the green contracting EDT wave (C) in Chart 2.  There is still room to exceed today's low if the market wishes to do so - still within the limits of a contracting EDT.
[Intraday Update - 12:50pm NYSE]
SPX cash tracking counts update
[green] EDT wave (C)-down.
[red] Impulse down from the ATH
[blue] Zigzag down from the ATH to (C) or [3]


Tuesday, March 17, 2020

Tuesday Update (3/17/20)

Not much has changed despite the intraday swings.  See charts and yesterday's comments for details.


Monday, March 16, 2020

Monday Update (3/16/20)


[PS - 730pm ET]
ES may shed some light on how low this leg can go, if this potential expanding EDT plays out - lower than 2216.5 on the March contract (Chart 3).  Each leg of this potential expanding EDT has the proper relative magnitude.  However, D-up took less time then B-up.


[EOD Update]
Tracking count update (Chart 1)
Red -  Friday's rebound high is [4]-up, now towards [5]-down
Blue -   A potential triangle wave 4-up,  low as 5-down of (C)-down or (3)-down of [3]-down when the low is in.

Regarding the bigger picture,  SPX is now crawling along the bottom BB,  and probing its 2018 crash lows (Chart 2).


[Intraday Update - 2:05pm NYSE]

The alt-red count is the most bearish, tracking the current low as (3) of [3] -  the red (3) is counted by downgrading the labels from the red (2) onward one degree lower (Chart 1).

SPX is probing its 2018 crash low (Chart 2)


Friday, March 13, 2020

MTU Weekend Ed. - ABC/123 and Long Term Tracking (3/13/20 close)

Part 1 -  Short Term Observations
Recap of yesterday's observations, perhaps more relevant given Friday's recovery. 

SPX has reached the lower BB in the monthly chart,  and meaningfully rebounded on Friday.  Keep an eye on the mid-band line which is at 2897 (Chart 1).


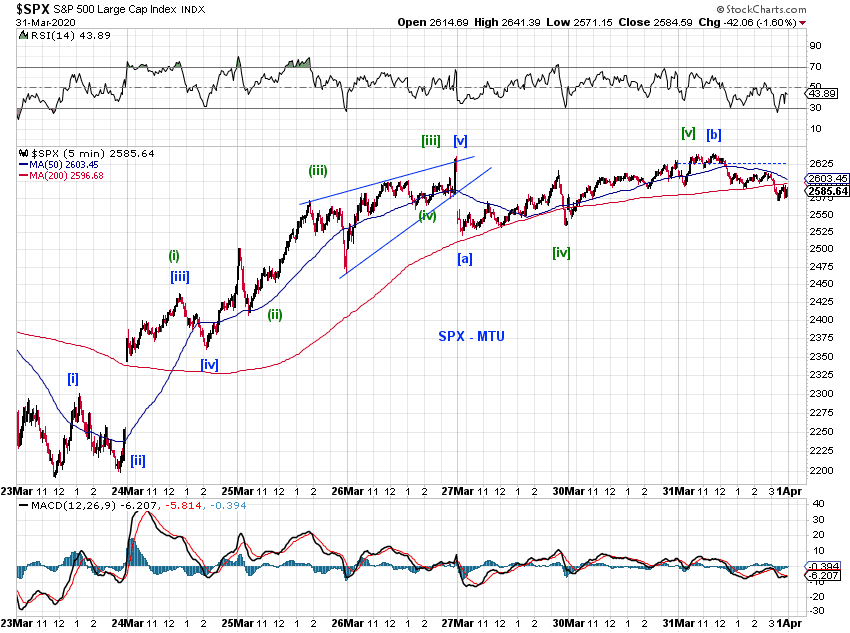
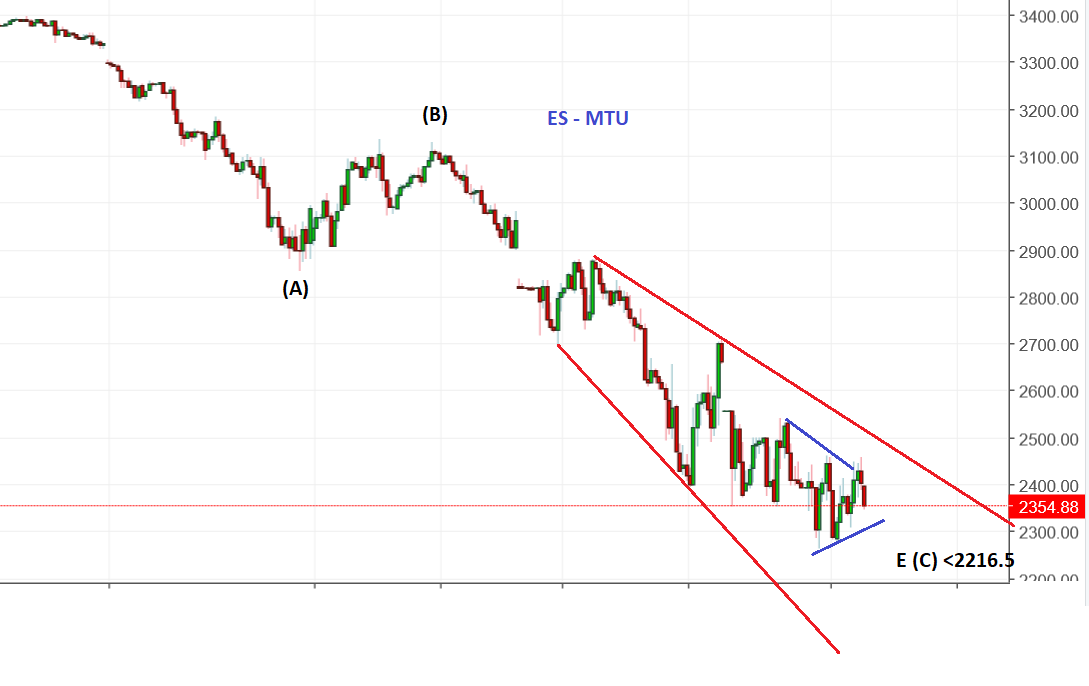
The structure since the ATH is likely an ABC or 123  (Chart 2 on ES and Chart 3 on SPX)

The low is likely to be retested if we have an ABC structure and breached if we have a 123 structure.

Part 2 - Long Term Observations

Chart 4 presents long term tracking counts on stocks (using DJIA) that I put together on Christmas 2015 (in the Long Term Outlook section of the side-panel).

I do not have time at the moment to  label the current chart (Chart 5). However, since the labels in Chart 4 would remain in the same positions, one can easily pair the two charts.

Based on the original tracking counts, the ATH would be
[blue]  Wave 1-up of wave (5)-up.   This is the most bullish count at the moment, but 2-down may not be over.
However, if it is the entire wave (5)-up, this would be the most bearish count.

[green]  Wave 3-up of (3)-up.   This would be quite bearish.

[red]  Wave d-up of (4)-down (expanded triangle)
or wave-b-up of (4)-down (expanded flat or triangle), need to have the red (3) coincide with the green [iii].

The red count is a bit stretched in light of how far the market has risen to its ATH , but not impossible.

An expanded triangle or an expanded flat would be the most bearish count as the 2009 low would be exceeded. 


 Short Term Charts


Long Term Charts 


Thursday, March 12, 2020

Thursday Update (3/12/20)

SPX has reached the lower BB in the monthly chart (Chart 1)

Tracking counts from the ATH, with the purple series of 1s2s being the most bearish and the blue ABC being the most bullish (Chart 2).

Chart 3 shows  details on SPX, and Chart 4 shows details on ES including overnight actions.

In light of the above, the simple blue zigzag down looks interesting.


Wednesday, March 11, 2020

Wednesday Update (3/11/20)

[Overnight Update - 11 pm EST]
In light of the overnight sell-off, here are the updated tracking counts.
Diagonal triangle down if low around here holds. (blue - (D) is short in duration and ended at the close on Mar 10th)
A third wave if the crash continues meaningfully.  (red)
[EOD Update] 
The immediately bearish scenario discussed yesterday likely played out (Chart 1 red).   SPX had a minor lower low but the low in ES was not breached. 

Now that key indices retested their lows today, potentially successfully, a rebound to correct the sell-off looks probable.  Keep an eye on the larger degree tracking counts (which remain unchanged as of now) and various overhead resistances (Chart 2 SPX and Chart 3 ES).  Note the positive divergence on the daily chart, which has been present over the past few days.  

Regarding the immediately bearish potential - if today's small-degree decline should extend, keep an eye on the 200-week SMA (currently at  2640 in SPX)