Stocks
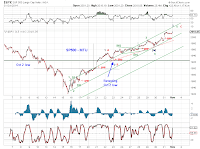
October saw near 10% swings in both directions in stocks. By the end of the month, benchmark indexes are at or near new record highs (Chart S1). In addition, the upswing from the October low has been so strong that five upward gaps remain unfilled (Chart S2).
Two of the three questions we discussed in Kiss, Triple Top or New High (10/24/14) remain.
[1] What is the upside potential of this upswing before (at least) a meaningful pullback?
[3] How does it fit into the longer term tracking counts?
The clues to these questions are likely in the top two long term tracking scenarios.
Chart S3 tracks the advance since the 2009 bottom in SP500. The current upswing is likely
[blue, bullish] wave (5) of [3] (with [4]-down and [5]-up to follow) or wave (5) of [C] (terminal). The Fib relations with the proposed wave (1) of [3] target 2035, 2170 and 2300 and end of 2015 Q1.
[red, very volatile] wave (d)-up of an expanded triangle wave [4]-down. This scenario would upset bulls and bears alike as it is full of bull-traps and bear-traps.
Following the completion of this wave (d)-up (Chart S2), wave (e)-down is likely to breach the October low before another multi-month wave [5] advance to higher highs.
Chart S4 tracks similar scenarios in the Russell2000 index.
Bonds
The 10-year U.S. Treasury yield index appears to have successfully retested the (green) 2007-2011 prior resistance trend line (Chart B1) in what appears to be an ABC (zigzag-B-flat) corrective decline in yield (Chart B2). Odds appear to favor yields trending higher towards the (red) 1987-2014 long term resistance trend line in Chart B1. The initial target is around 2.5%
When yields can break above the red and gray overhead resistance trend lines is unclear at the moment, as the 1987-2014 trend line has so far and once again been dominating.
USD
There is no change to the long term tracking scenarios outlined in last month's outlook. See Chart D1. However, the USD index appears to be wrapping up a five wave advance since its May 2014 low. (Chart D2)
If the blue triangle in Chart D1 plays out, expect a multi-month wave D decline. So far, the advance in the USD index since the 2011 low has channeled well, a feature that is consistent with a corrective (wave C) move.
Gold
Gold (priced in USD) managed a fresh low in its post-2011 sell-off this past week (Chart G1).
If this breakdown in Gold turns out to be successful, the demise of the two-year sideways consolidation range (Chart G1) would suggest a downside target around 800 to 900.
However, there are signs of a potential bear trap.
[1] Friday's sell-off in Gold appears to be completing a potential small-degree EDT (Chart G1). The sell-off was in response to the surprise policy actions by Japan, which could be consistent with the personality of wave E of a triangle (EDT).
[2] Positive technical divergences are emerging in Chart G1.
[3] As discussed in Monthly Outlook Update (10/3/14): To the extent that Gold, as a physical asset, can move independently, recent declines in gold prices could be the tail end of a wave B pullback across several currency denominations. If so, expect a strong wave C-up next. See Chart G2.
Let's see what the market delivers next.


